ISUCON measurement tends to scatter across tools: pt-query-digest for SQL, alp for access logs, top and pprof for CPU, and eyeballs for configuration. Four terminals per benchmark run, and none of it is saved anywhere.
isutools is a Go OSS (MIT) that collects all of it into one dashboard. Integration is effectively one line. Every benchmark leaves an automatic snapshot, and you can diff between runs.
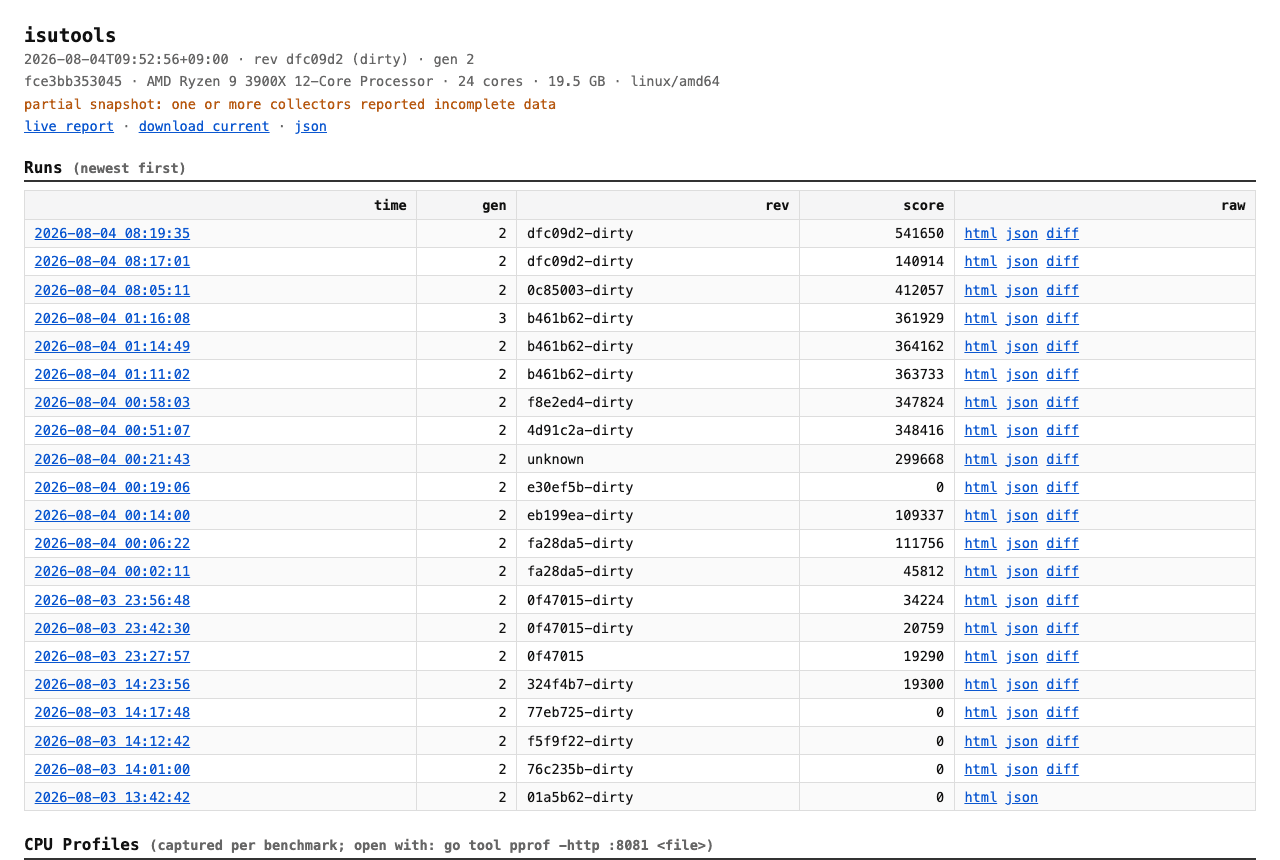 isutools dashboard run history with scores and git revisions
I used it to take private-isu from a score of 0 to 541,650 in one day — that full log is in its own article. This post focuses on isutools itself: setup and features.
Quickstart
go get github.com/ekusiadadus/isutoolsThe only application change:
// before
db, err := sqlx.Open("mysql", dsn)

// after — SQL profiling + admin server are now live
db, err := sqlx.Open(isutools.SQLDriverName("mysql"), dsn)
The dashboard comes up at http://localhost:19191/. To add per-path HTTP metrics:
http.ListenAndServe(":8080", isutools.HTTP(r))Operating it is two POSTs in your bench script:
curl -XPOST localhost:19191/reset   # zero the collectors
./run-benchmark
curl -XPOST "localhost:19191/save?score=123456"  # persist with the score
Saved runs are listed by timestamp on the home page; click one and the full measurements of that moment open. Score and git revision are always recorded together, so "which commit scored what" never gets lost.
What you get per run
- SQL — per-normalized-query total time, call count, p95.
WHERE id = 999andWHERE id = 1aggregate as the same query - HTTP — per-path latency stats;
ISUTOOLS_PATH_RULESregex rules normalize/@user1,/@user2into/@* - nginx access log — alp-style aggregation, LTSV and JSON formats, via a shared volume
- Processes + whole-machine CPU — which process hogs the CPU, plus a busy/idle breakdown that answers "are we even saturating the hardware?"
- DB schema — tables and indexes as of benchmark start; no more "did I add that index?"
- pprof — CPU profiles captured automatically on reset
- Counter API —
isutools.Count("user_cache_hit")for anything you want to track (cache hit rates) - User Flow — top session page transitions; you can see how the benchmarker behaves
The advisor — detecting unconfigured staples
My favorite part. The advisor reads MySQL, nginx, OS, and Go settings and flags ISUCON staples that are still unconfigured.
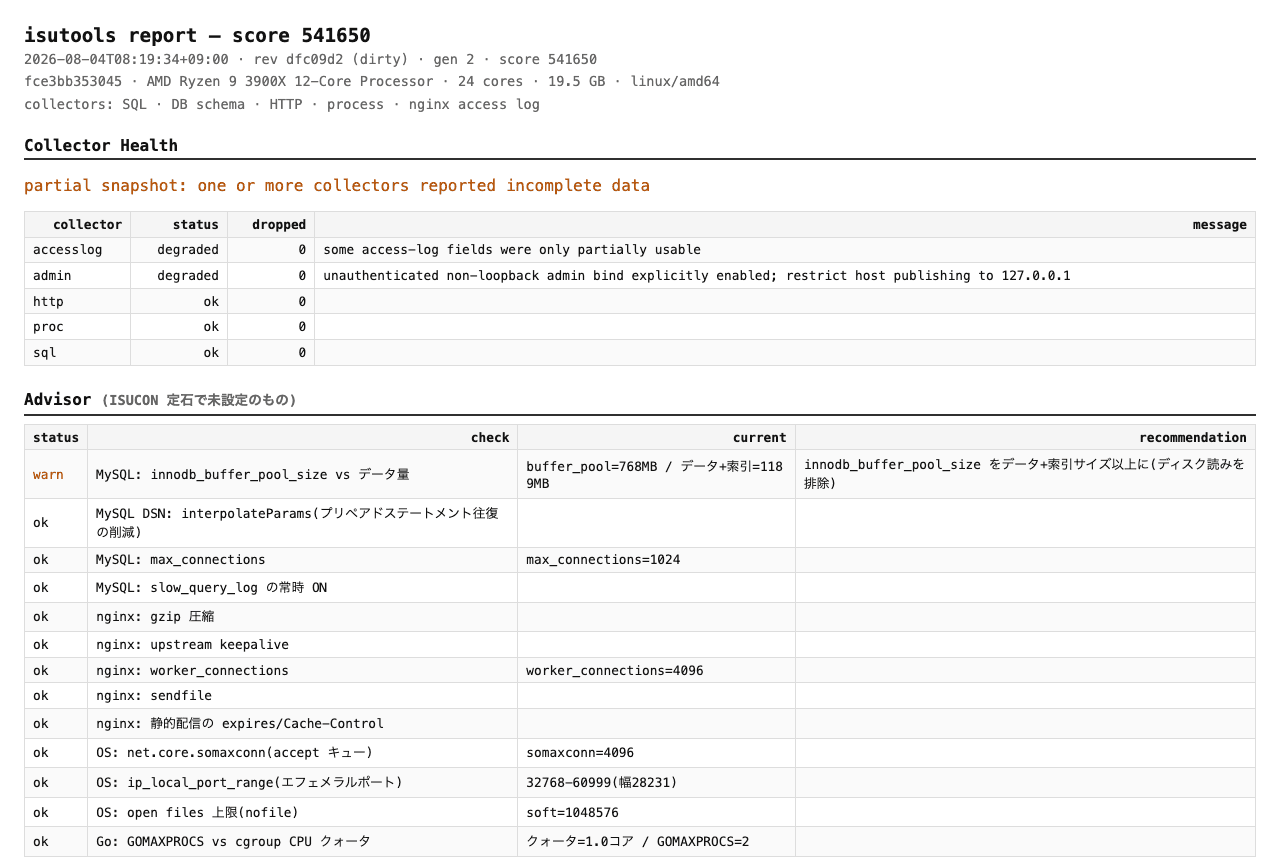 isutools advisor section detecting unconfigured MySQL, nginx, OS, and Go settings
On its first private-isu run it immediately flagged: no interpolateParams (two round trips per prepared statement), no nginx gzip, and an innodb_buffer_pool_size a ninth of the data size. Applying the three gave +16%. Items flip to ok once fixed, so it doubles as a checklist.
The diff — "did it improve, or did the bottleneck move?"
The scary failure modes in tuning are bottlenecks that merely move, and changes that silently break something else. isutools diffs two runs per query and per path.
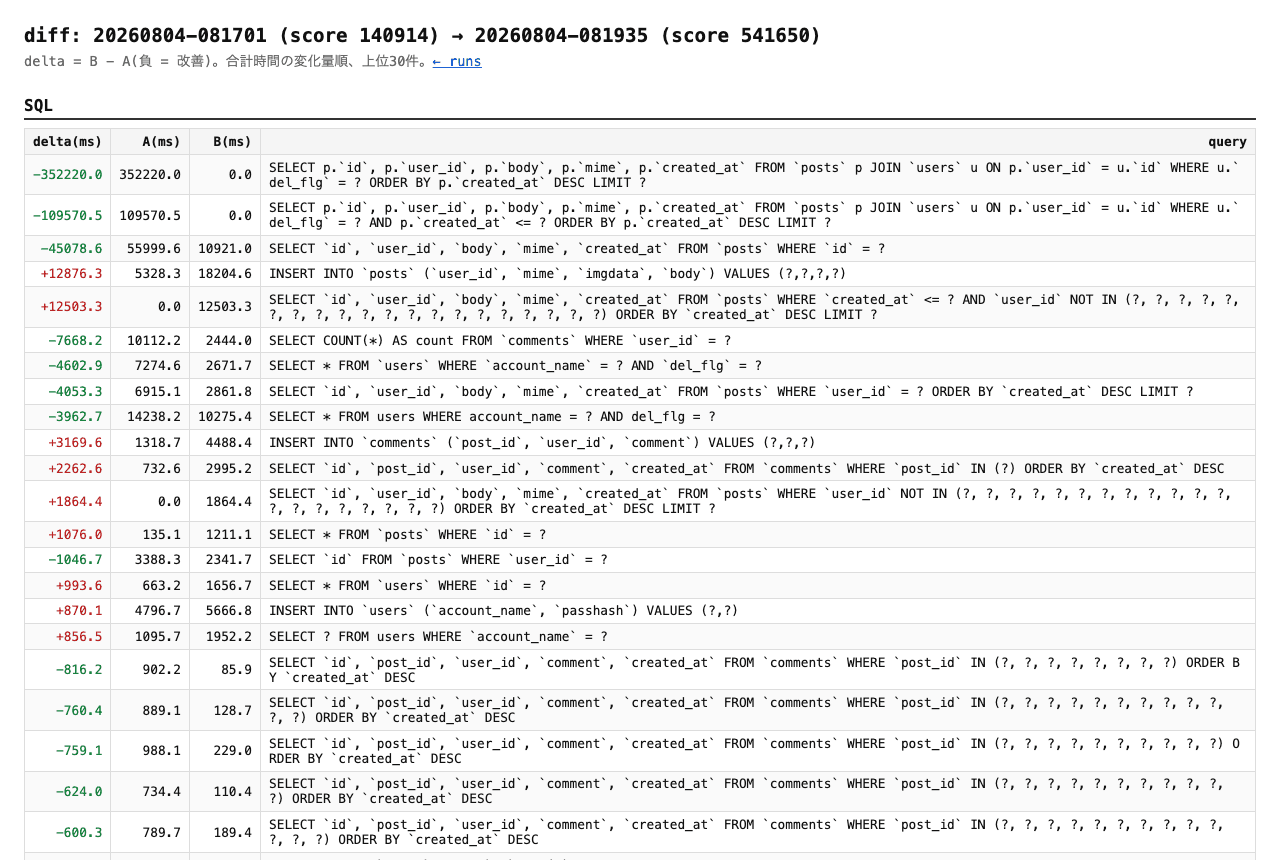 isutools diff view showing per-query total-time deltas between two runs
This is how I caught, within minutes, an index addition that made the timeline JOIN 260x slower (the optimizer had been lured onto the new index).
Overhead: within noise
A measurement tool that lowers your score defeats itself, so overhead is verified by ABBA measurement (four benches: off, on, on, off): -0.58%, within noise. The procedure ships as examples/abba.sh so you can reproduce it on your own setup.
Measure remotely, view locally
The intended workflow is: measure on the contest server, download the snapshot files, open the dashboard on your laptop. All data lives as files under ISUTOOLS_DATA_DIR; nothing ever leaves the machine.
The admin server binds to 127.0.0.1 by default. Exposing it remotely requires token auth and is fail-closed without one; an explicit environment variable opts into unauthenticated mode for SSH-tunnel setups only.
FAQ
Q. Does it work without sqlx? — It is a database/sql driver proxy, so plain sql.Open and most ORMs work as long as you can pass a driver name.
Q. Can I use it on a production web service? — The design is ISUCON-focused, but it works fine for performance investigation of Go web apps. For always-on production APM, OpenTelemetry-based tooling is the right lane.
Q. Multi-server setups? — Single-server measurement today; multi-server (split DB) support is on the roadmap.
Links
- GitHub: github.com/ekusiadadus/isutools (stars keep it going)
- Field log: Breaking 500k on private-isu in One Day with isutools
- Behind the scenes: isutools Dev Diary — Building an ISUCON Profiler in a Day with Claude Code and Codex
- Bugs & requests: Issues