I spent one day tuning private-isu, the classic ISUCON practice app, and took the Go implementation from a score of 0 to 541,650 (with zero failures throughout). Every single change was driven by numbers from isutools, a profiling module I built as I went. This post is the chronological log of which measurement led to which fix, and how the score moved.
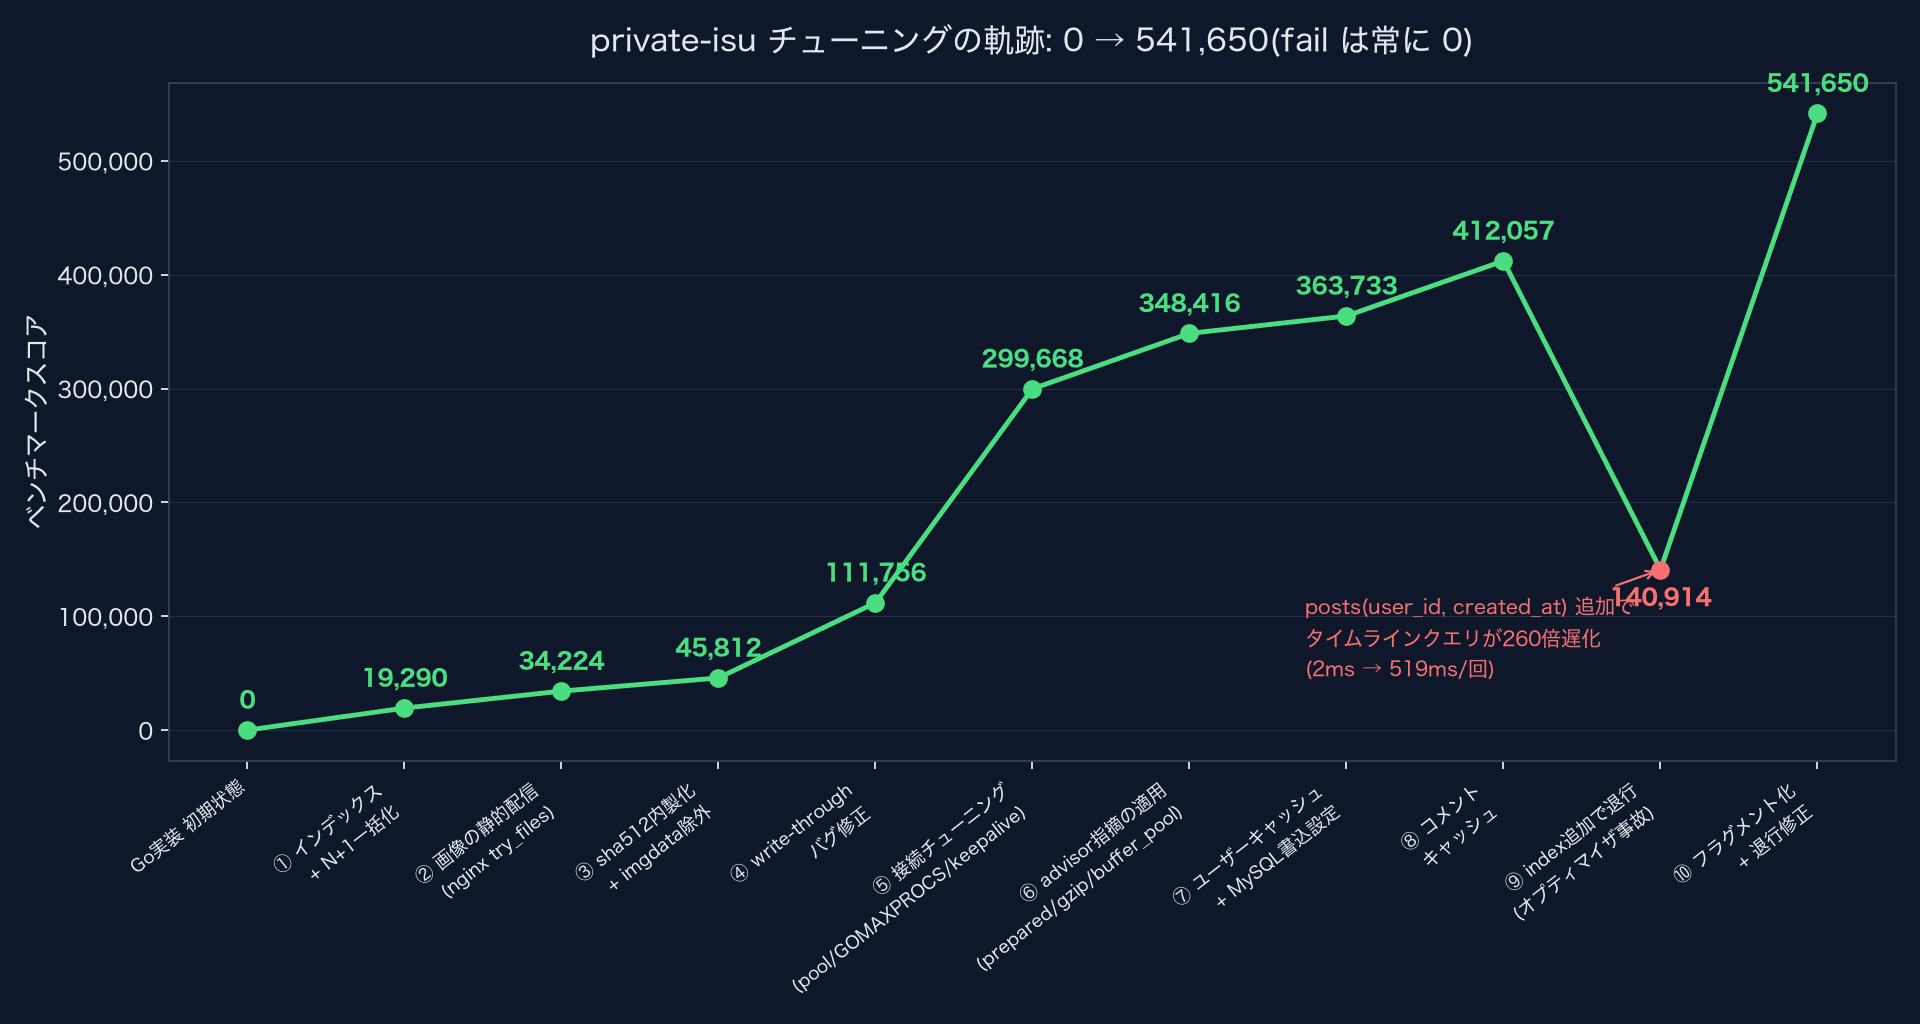 private-isu score progression from 0 to 541,650
Here is the step-by-step summary:
| Step | Change | Score |
|---|---|---|
| Baseline | Stock Go implementation | 0 (55 fails) |
| 1 | Indexes + batched N+1 queries | 19,290 |
| 2 | Static image serving (nginx) | 34,224 |
| 3 | In-process sha512 | 45,812 |
| 4 | Write-through placement bug fix | 111,756 |
| 5 | Connection tuning (pool / GOMAXPROCS / keepalive) | 299,668 |
| 6 | Applying advisor findings (prepared / gzip / buffer pool) | 348,416 |
| 7 | User cache + MySQL write settings | 363,733 |
| 8 | Comment cache | 412,057 |
| 9 | Optimizer regression from a new index (diagnosed) | 140,914 |
| 10 | Pre-rendering + regression fix | 541,650 |
Environment
- WSL2 + Docker Compose (standard private-isu stack: nginx / Go app / MySQL / memcached)
- To emulate contest hardware, the app and MySQL are each capped at 1 CPU (
cpus: "1"in compose). The host has 24 cores, but they stay unused - The benchmarker runs in Docker on the same host
The measurement layer: isutools
Before tuning anything, I built isutools, a Go module that concentrates every measurement in one place (setup and the full feature tour live in a dedicated introduction). Integration is effectively one line:
db, _ = sqlx.Open(isutools.SQLDriverName("mysql"), dsn)That starts an admin server on localhost:19191. The loop is just POST /reset → run the bench → POST /save?score=N, and every run leaves behind:
- SQL (per-normalized-query total/count/p95) / HTTP (per path) / nginx access log (alp-style)
- Per-process CPU plus whole-machine CPU utilization (busy/idle breakdown)
- DB schema at benchmark start (the index list) and an advisor that flags unconfigured ISUCON staples
- Per-benchmark snapshot history with a diff view between runs
- Automatic CPU profile capture (pprof) and per-session User Flow (page transitions)
The home page is the run history — every run of this day, with git revision and score. Click a row and the full measurements of that moment open up.
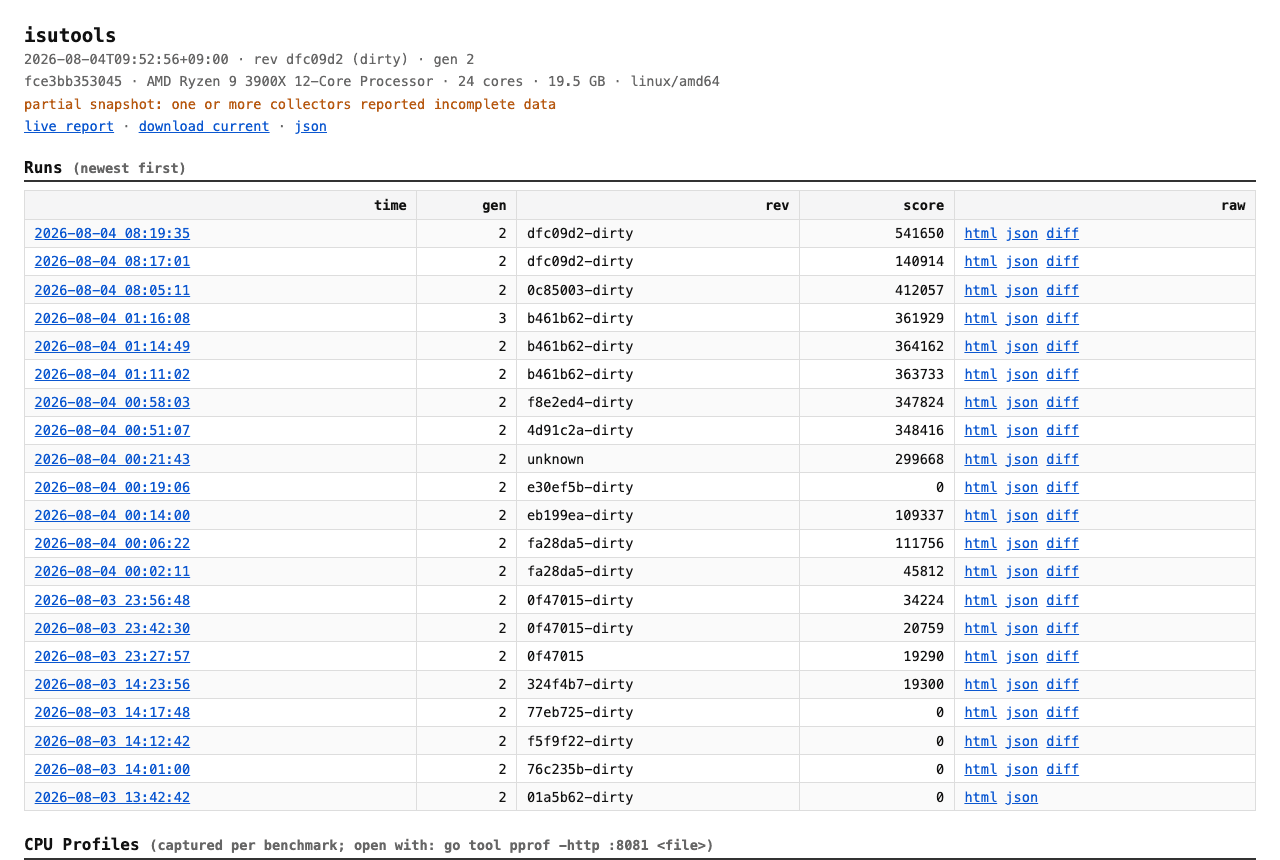 isutools dashboard run history with scores and git revisions
Every step below is just "fix whatever one of these dashboard sections points at."
The chronological tuning log
Baseline: score 0 (55 fails)
The stock Go implementation drowns in timeouts. The top SQL entry is SELECT * FROM comments WHERE post_id = ? ORDER BY created_at DESC LIMIT 3 at 450 seconds total across 1,118 calls. The DB Schema section shows comments has no index. The process section shows mysqld at 57% CPU.
1. Indexes + batched N+1 → 19,290
Added comments(post_id, created_at) and posts(created_at). Collapsed the triple N+1 in makePosts (counts, latest-3 comments, users) into three batched queries (GROUP BY / window function / IN clause), and gave the timeline a JOIN + LIMIT 20. Timeouts disappeared entirely — first positive score.
2. Static image serving → 34,224
The HTTP section showed /image/* dominating bandwidth (nearly 180 seconds total). Exported all DB-stored images to files once, served them via nginx try_files + expires 1d, and added write-through so images read from the DB get written to disk for next time.
3. In-process sha512 → 45,812
POST /login was at 63 seconds. The code shelled out to the openssl command for every password hash. Replaced with crypto/sha512 (byte-identical output). Also dropped the unused imgdata column from the /posts/:id query.
4. The write-through placement bug → 111,756 (2.4x)
The metrics said app-served images were not going down after static serving. It turned out the os.WriteFile added in step 2 sat after the return in the success branch — it had never executed. Moving it inside the success path alone gave 2.4x. Without measurement I would have kept believing static serving was done.
5. Connection tuning → 299,668
The new whole-machine CPU metric read "11.6% busy / 88.2% idle" — the hardware was nowhere near saturated. Adding db.SetMaxOpenConns and GOMAXPROCS=2 (to stop the Go scheduler thrashing against the 1-CPU quota) massively raised throughput — and immediately triggered a 502 storm from nginx→app connection exhaustion (score 0). Upstream keepalive + worker_connections 4096 fixed it and the score jumped to 300k.
6. Applying the advisor's findings → 348,416
I added an advisor to isutools that detects unconfigured ISUCON staples. On its very first run it flagged: no interpolateParams (two round trips per prepared statement) / no nginx gzip / innodb_buffer_pool_size at 128MB (a ninth of the 1,189MB of data+indexes). Applying all three gave +16%.
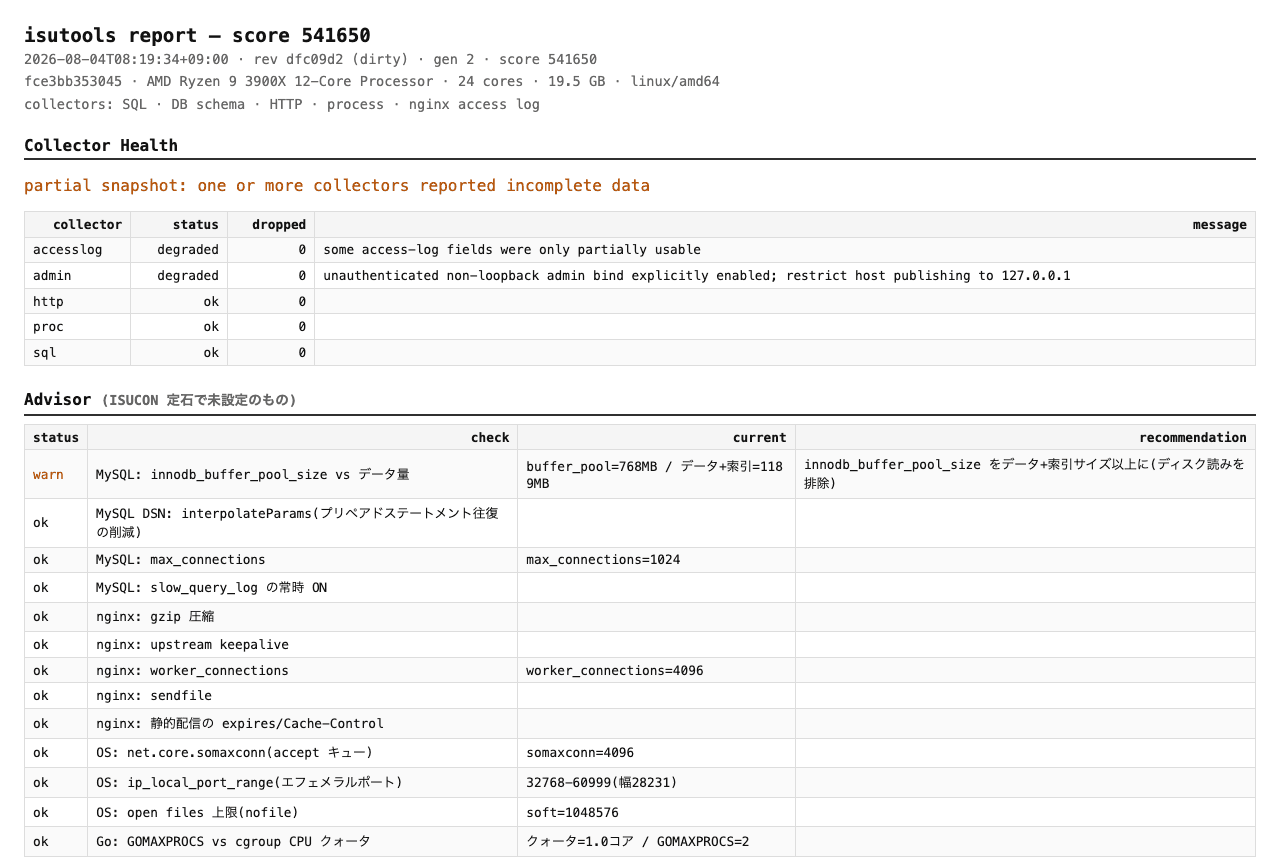 isutools advisor section detecting unconfigured MySQL, nginx, OS, and Go settings
After applying, only the buffer_pool warn remains (the container's 1GB memory cap is the practical ceiling). Items flip to ok as you fix them, so it doubles as a checklist.
7. User cache + MySQL write settings → 363,733
Added a sync.Map user cache (cleared on /initialize and on ban). Instrumented with isutools.Count, the dashboard showed a 99.85% hit rate (710,745 hits / 1,064 misses). MySQL got innodb_flush_log_at_trx_commit=2 and binlog disabled.
8. Comment cache → 412,057
A single cache of post_id → all comments (newest first), deriving count = len() and latest-3 = prefix. Both remaining makePosts queries (94 seconds per bench combined) vanished. 97.9% hit rate.
9. The accident: a new index dropped the score to 140,914
Right after adding posts(user_id, created_at) for user pages, the score fell to a third. The diff and SQL sections identified the culprit instantly: the timeline JOIN query went from 2ms to 519ms (260x). The optimizer had been lured onto the new index and the query plan collapsed.
Here is the diff view after the fix — the JOIN query's -352 seconds disappears in green, replaced by a NOT IN variant that costs a few seconds:
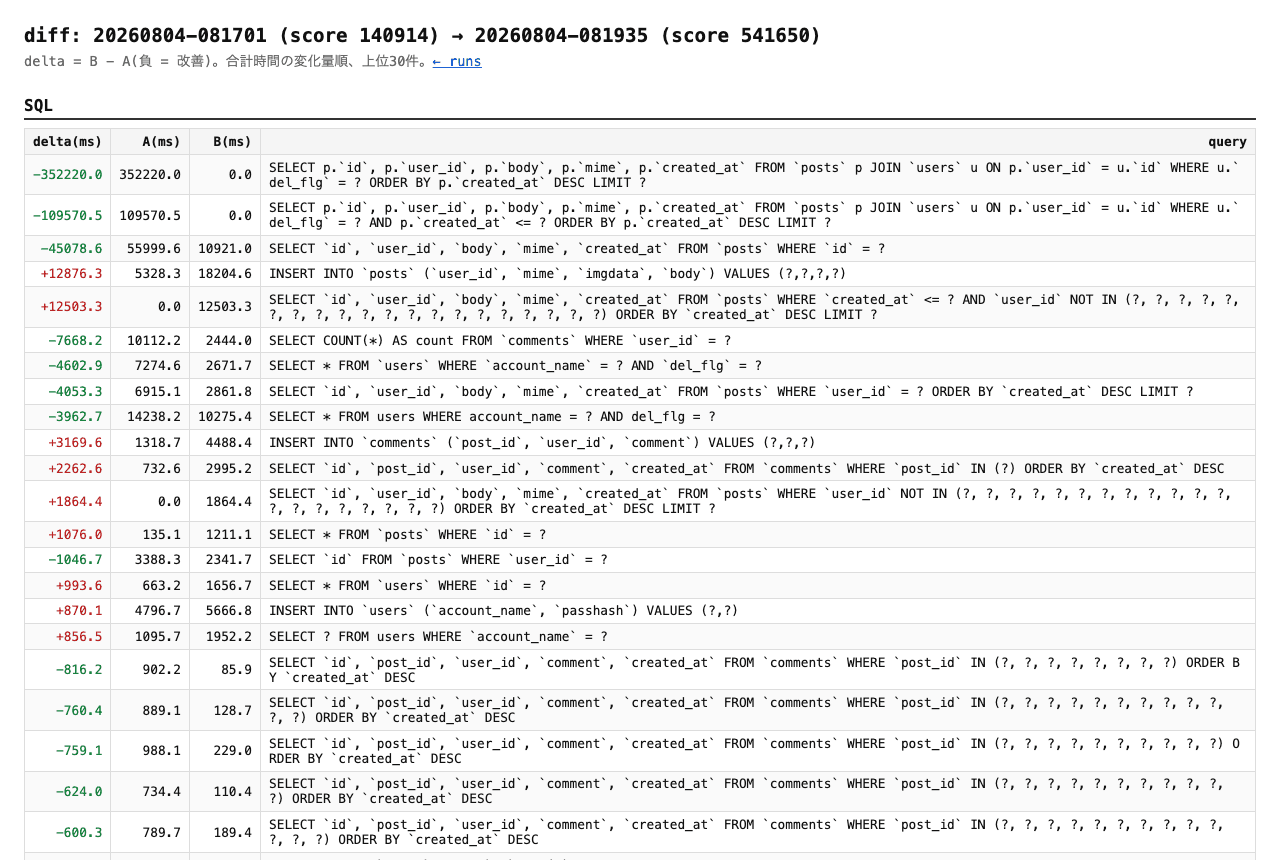 isutools diff view showing per-query total-time deltas between two runs
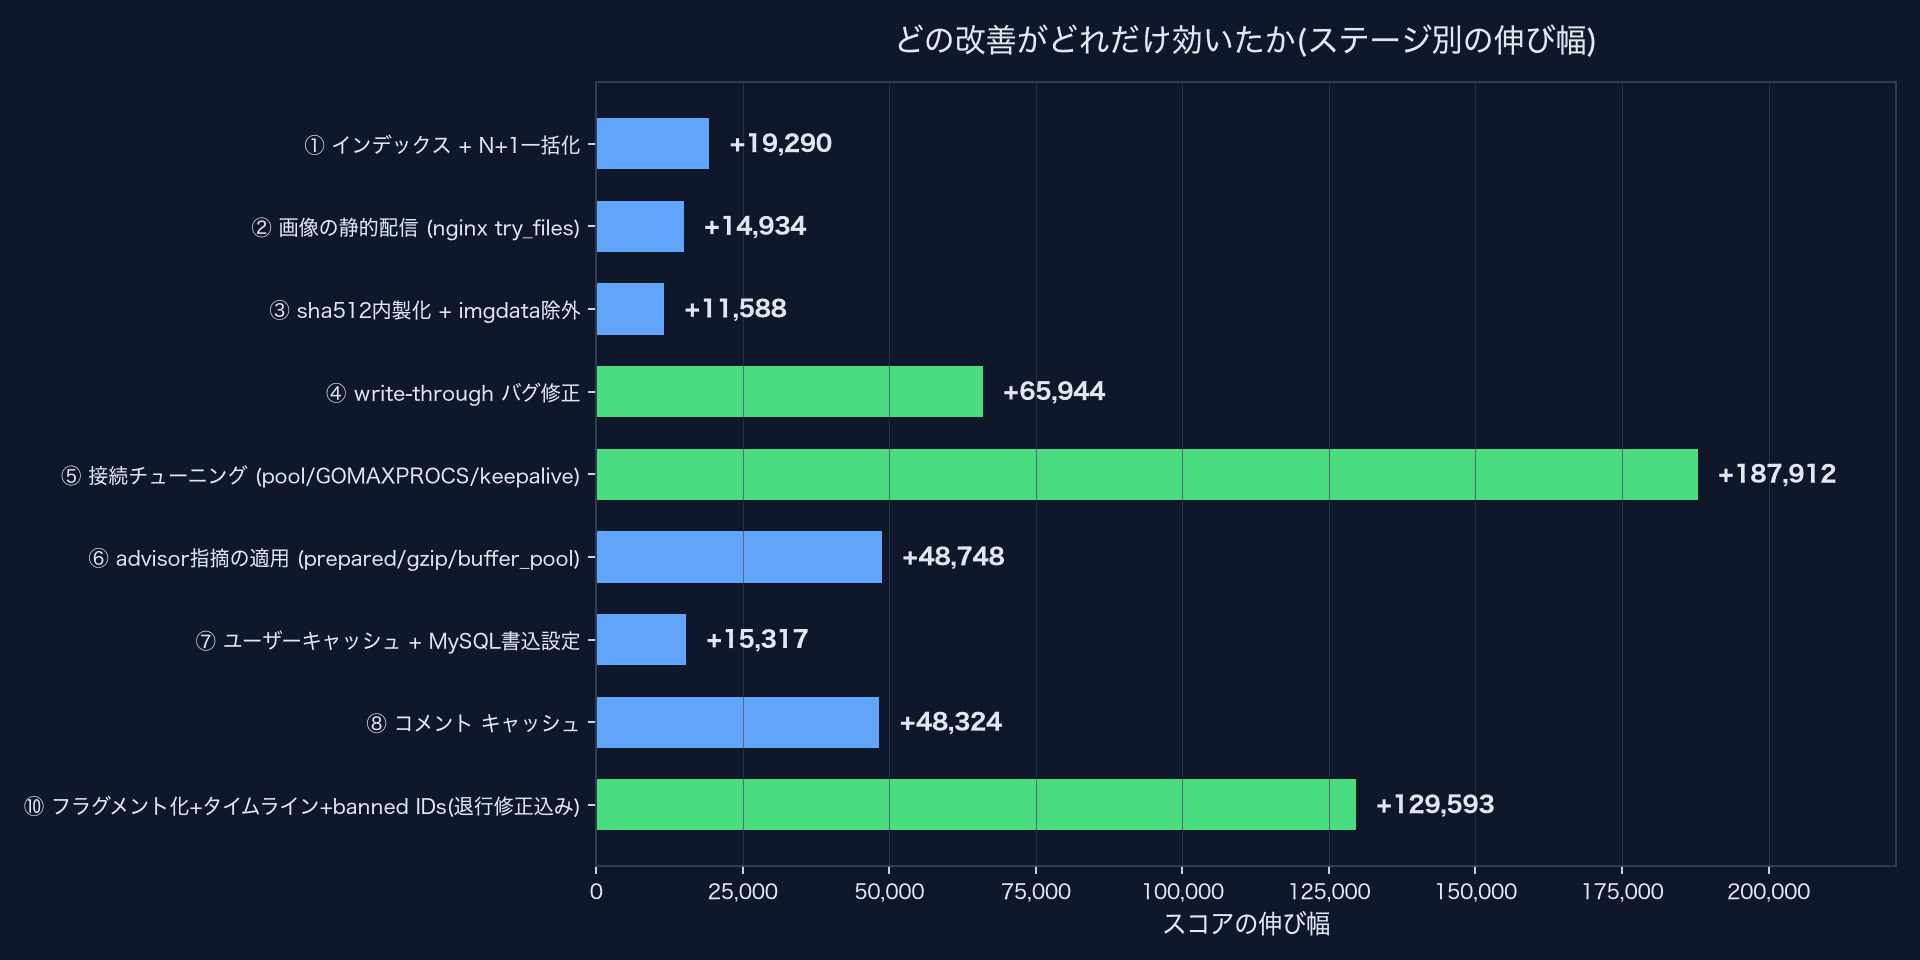 score gain per tuning stage
10. Pre-rendered fragments + the regression fix → 541,650
The final trio:
- Keep soft-deleted user IDs in memory and switch the timeline from the JOIN to
user_id NOT IN (...)+idx_created_at(the real fix for step 9) - Cache the first timeline page rows (invalidated on post/ban/initialize)
- Pre-render each post's HTML fragment: render post.html manually once, cache it split at the CSRF token position, and serve requests with a 3-part concat
Before shipping the manual renderer I verified byte-for-byte equality with the template output — which is how I discovered that html/template escapes + as + (UTF-7 defense; the +09:00 timezone and emoticons in comments showed up as diffs). The benchmarker validates HTML structure, so without that verification this would have been a mountain of fails.
Lessons
- Measure, don't guess. Across ten score updates, the bottleneck repeatedly wasn't where I expected (the write-through bug, GOMAXPROCS, the optimizer regression). Automatic per-bench snapshots and diffs make "did it improve, or did the bottleneck just move?" a one-glance question
- Making things faster reveals the next wall. The moment step 5 sped up the app, nginx→app connections ran dry and the score went to 0. A 502 storm is also a sign your tuning is working
- Indexes are not free. Adding one can wreck another query's plan (260x here). Always re-bench after adding an index
- The benchmarker checks correctness too. Switching sessions to CookieStore failed the CSRF checks (expected 422) instantly. Change behavior for speed and it gets caught
- Measurement overhead can be engineered away. ABBA measurement (off→on→on→off) with isutools enabled showed -0.58% — within noise
Try isutools
Every measurement in this post came from isutools (MIT licensed). Integration is a one-line change to sqlx.Open, and you get SQL / HTTP / nginx logs / processes / DB schema / pprof / advisor / diff / User Flow in one dashboard. Overhead verified at -0.58% (within noise) via ABBA measurement.
db, _ = sqlx.Open(isutools.SQLDriverName("mysql"), dsn)It should be useful for ISUCON practice and real contests, and for performance work on Go web apps in general. Bug reports and feature requests welcome on GitHub Issues — and stars keep the project going.
What's left
Compared with Giarrium's 1M-point run, the remaining levers are self-managed sessions, escaping html/template for the page shell, and pprof-driven micro-optimization. 541,650 sits just before day 25 (814,586) of his run. To be continued in another post.
Links
- The profiler (OSS): github.com/ekusiadadus/isutools
- The tuned app: github.com/ekusiadadus/private-isu (fork of catatsuy/private-isu)
- References: The Tuning Book (Japanese), Giarrium's private-isu series