The ISUCON11 qualifier asks competitors to speed up ISUCONDITION, a web service that stores chair-condition reports and serves lists, histories, graphs, and trends. Its benchmark combines continuous writes with reads and aggregation, checks required behavior, and reports a performance score.
I ran two three-hour comparisons between Astra working alone and Astra coordinating GPT-5.6 Sol workers. This article puts the controlled rerun first and retains the initial study below with its original measurements and figures.
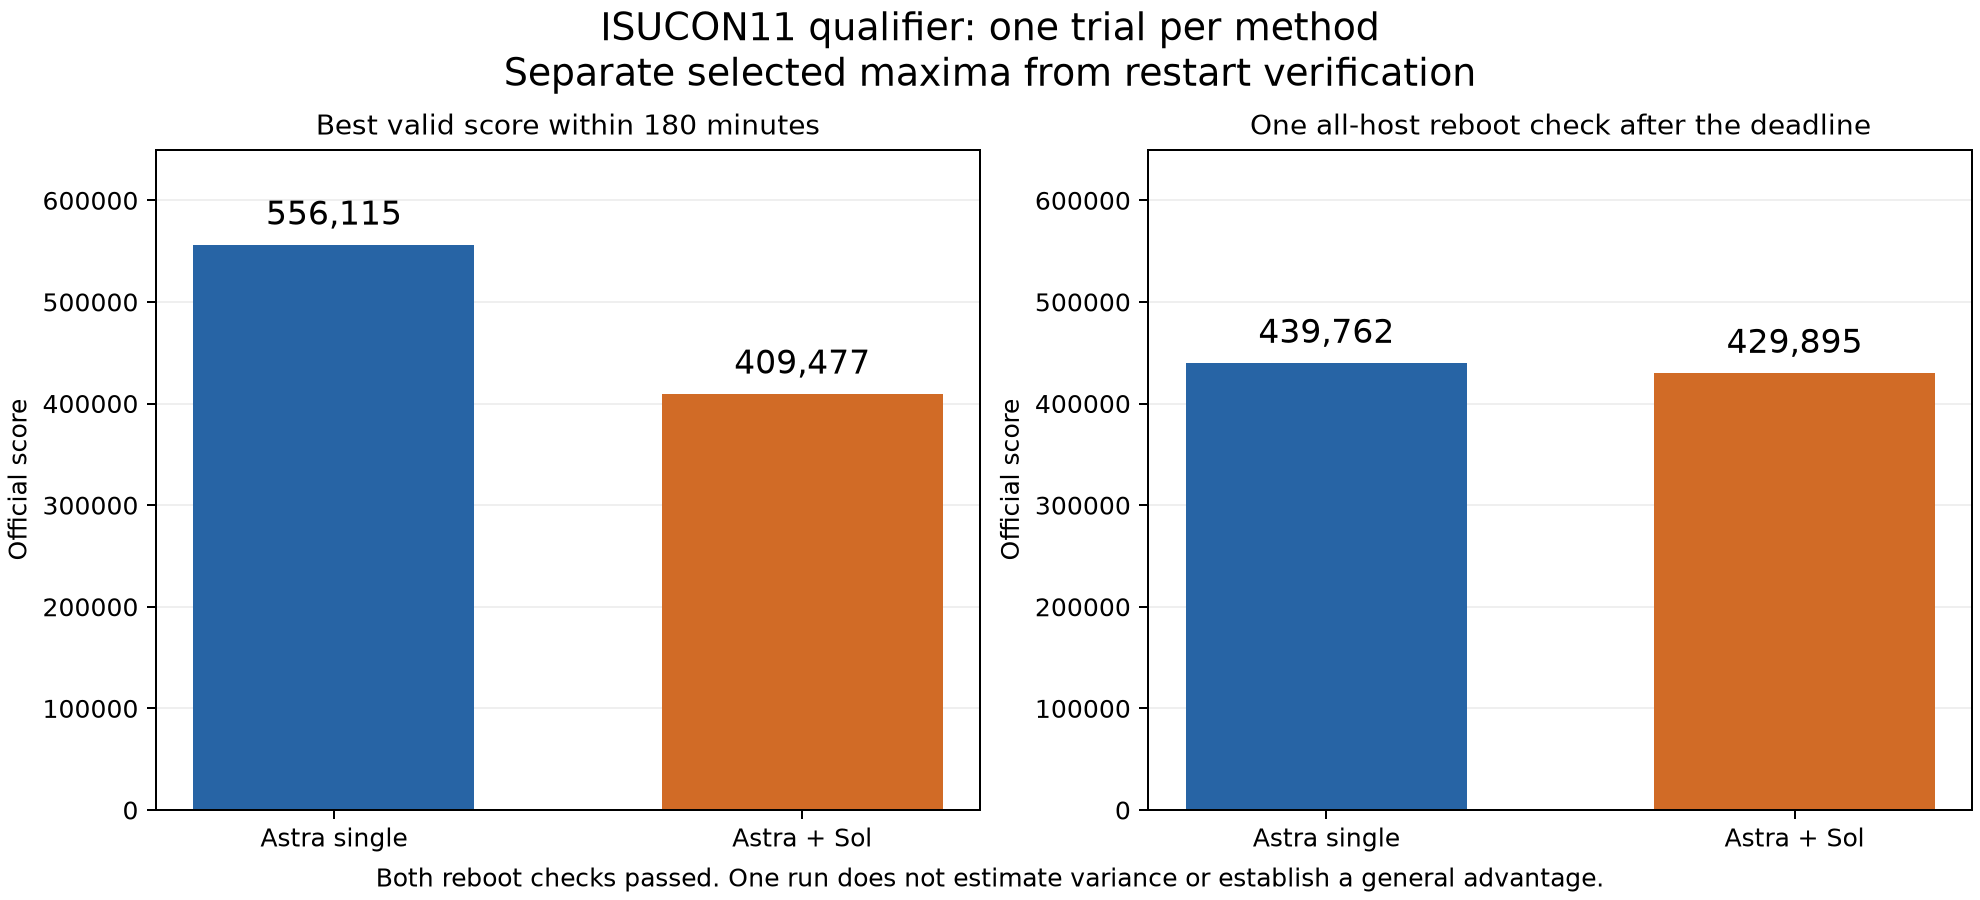
Controlled rerun: 11:14–14:14 JST on September 13, 2026
In the completed 180-minute rerun, I did not observe an efficiency advantage from the coordinated setup. Solo measured more candidates, used fewer recorded tokens, and achieved the higher in-window score. After both selected versions were rebooted and measured once, however, the scores were only 2.3% apart. One independent trial per arm cannot establish that this small gap is significant or repeatable.
Results
| Metric | Astra solo | Astra + Sol |
|---|---|---|
| Valid baseline | 1,627 | 1,843 |
| Best valid score within 180 minutes | 556,115 | 409,477 |
| Selected version after reboot | 439,762 / pass | 429,895 / pass |
| Normal measurements, pass / fail | 40 / 3 | 23 / 1 |
| Diagnostics, pass / unfinished | 3 / 1 | 7 / 0 |
| Recorded total tokens | 40,948,900 | 46,719,114 |
| Uncached input | 1,018,380 | 1,718,097 |
| Output | 177,176 | 390,713 |
Solo's in-window peak was 1.358 times the team's. Its reboot result fell 20.9% from that peak, while the team's rose 5.0%; reboot, initialization, host and load variation, and selecting a maximum cannot be separated by one follow-up run. The reboot scores therefore answer a narrower question: both selected versions still passed after a full restart, and their observed scores were close in that measurement.
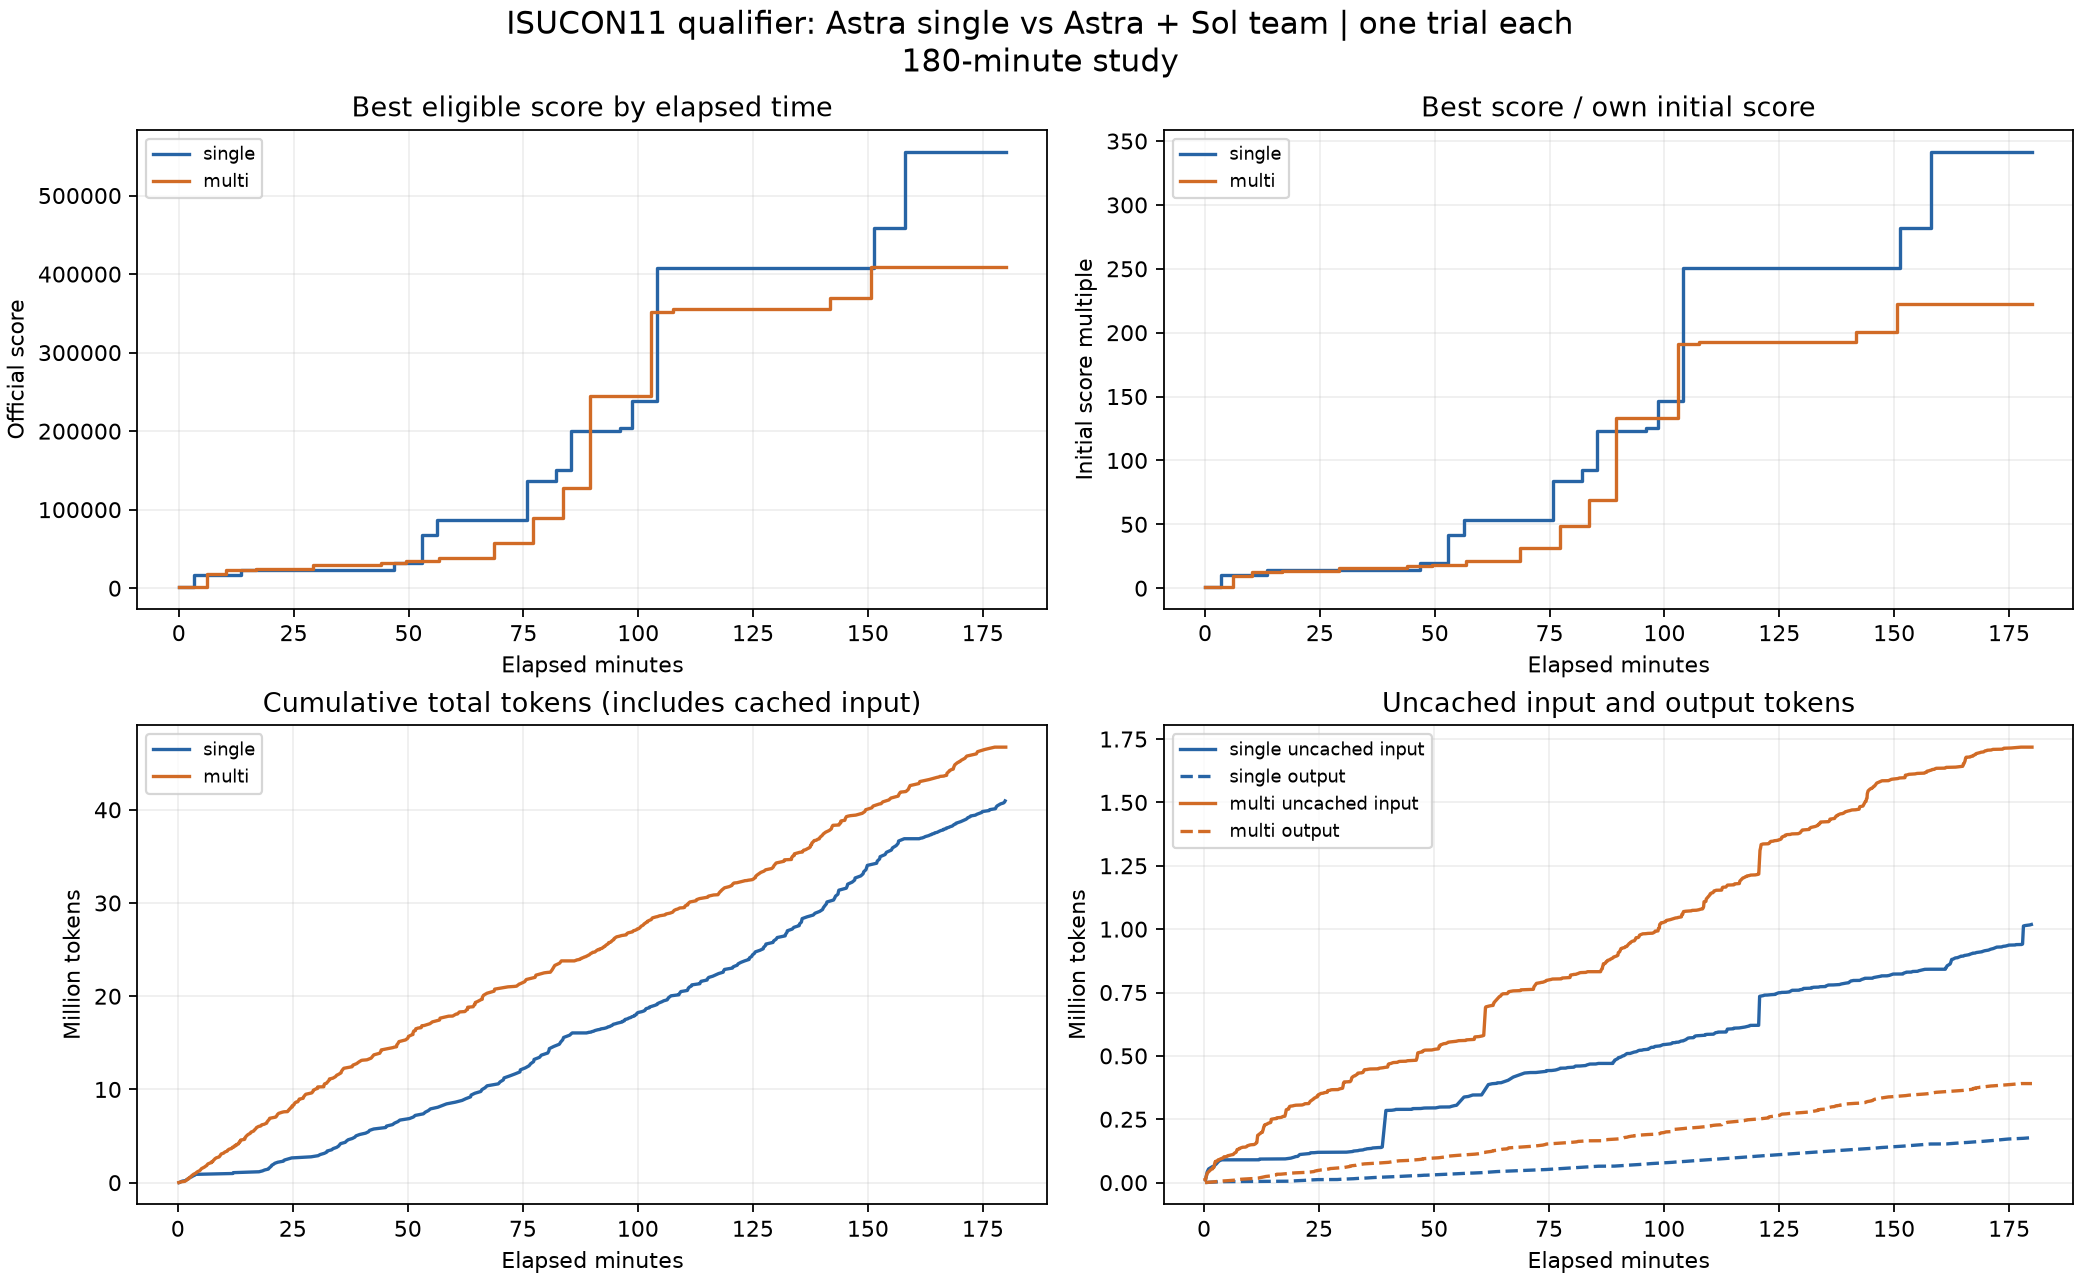
Solo reached 10,000, 50,000, and 100,000 first. The team reached 250,000 about 1.1 minutes earlier, but never reached 500,000; solo did so at 158.08 minutes. The 180-minute average of the running best was 238,620 for solo and 200,449 for the team. These are paths from this run, not expected results for future trials.
SDK parent and managed workers
Both parents were Astra/high sessions run through the official Codex Python SDK, openai-codex 0.154.0, using ChatGPT Pro authentication. The coordinated arm's children were managed Sol/high Codex CLI workers. This was not an Agents SDK application calling API models, and the team did not use Codex native subagents.
The parent gave each worker a hypothesis, current baseline commit, owned paths, required evidence, and validation method. Workers ran in dedicated clones with operating-system restrictions on writable paths, networking, and Git metadata. A host-side broker exposed only pinned control and experiment operations. The parent collected each patch, inspected and committed it, obtained independent review, and submitted measurements through a serialized executor. The two-worker cap was enforced. Stale work based on an old baseline became a new attempt, while revisions of the same hypothesis and baseline reused the same thread.
The team used 29 child threads in 34 invocations, including five resumes. Children overlapped for only 8.00 minutes. A completed read-only review with no diff remained in prepared state and occupied one slot for 28.01 minutes; two launches failed because the cap appeared full. This proves lost worker capacity, but the experiment did not measure a counterfactual score loss. The control software was kept fixed and was not repaired during the trial.
Score, tokens, and cost over the run
The following figure relates the running best valid score to elapsed time, cumulative recorded tokens, and allocated EC2 instance-hours. A flat score while tokens increase means that expenditure has not yet produced a new measured best; it does not mean the investigation was worthless.
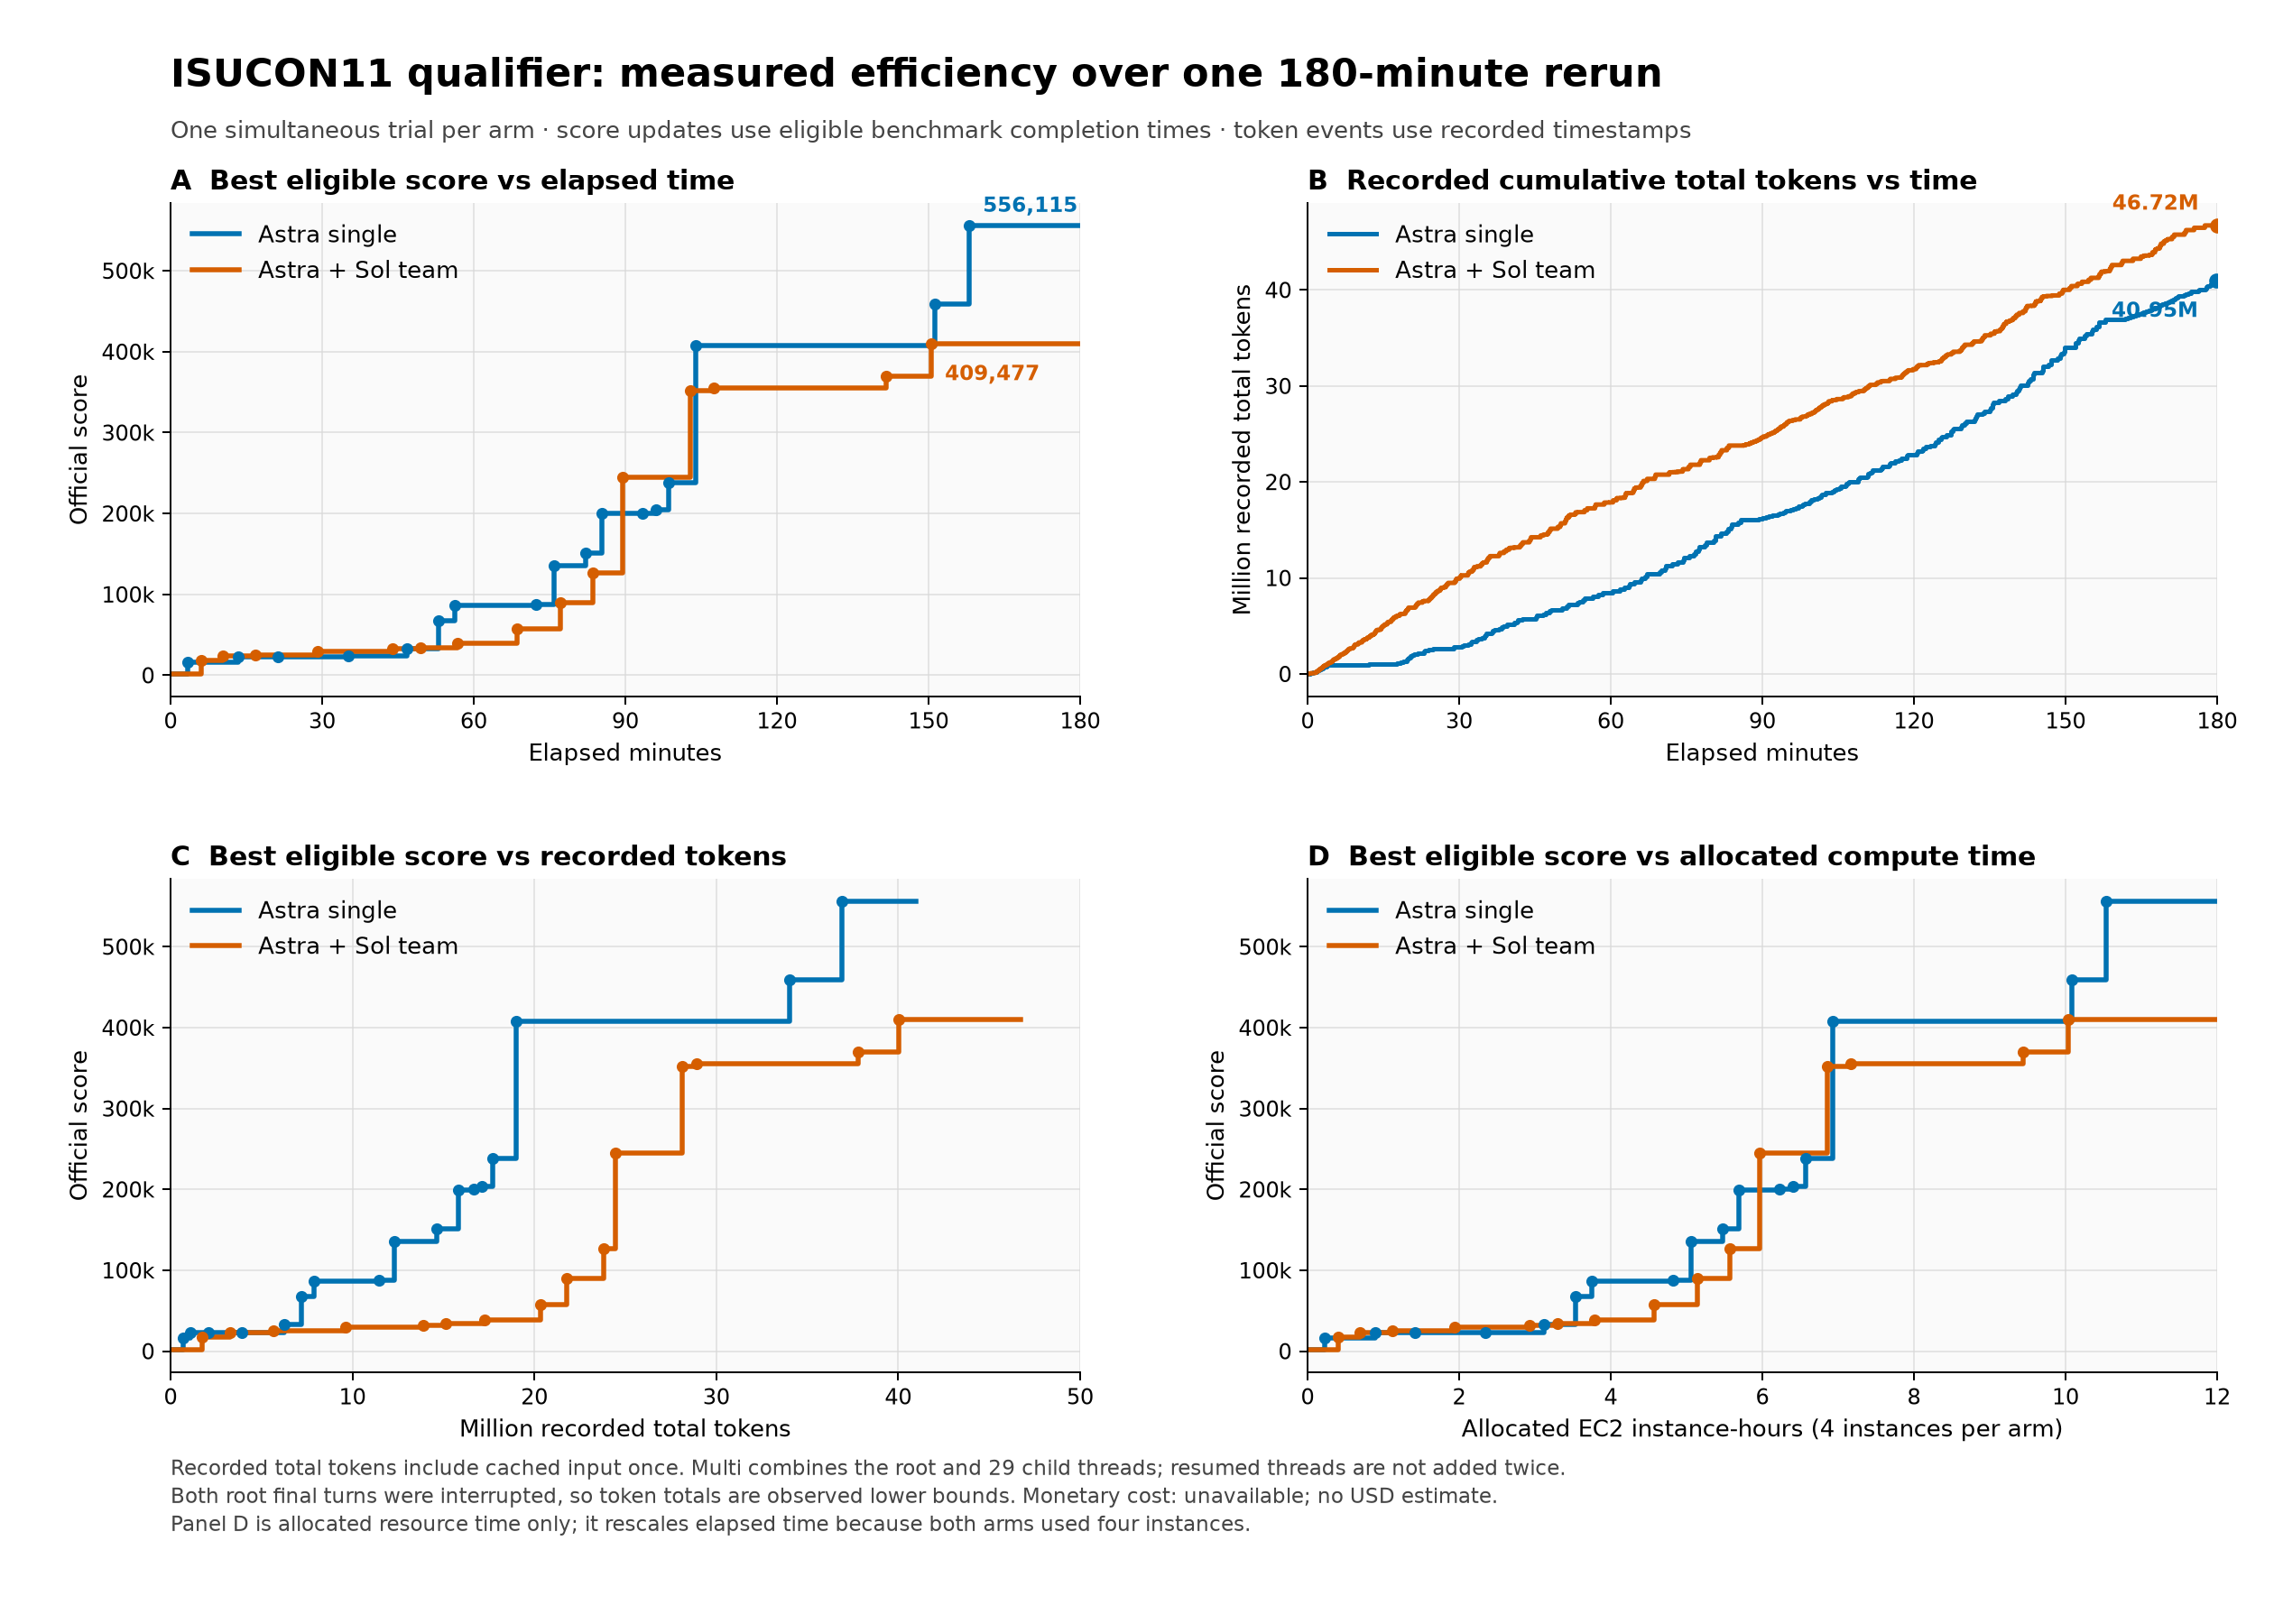
Usage updates are merged chronologically across threads, without counting resumed threads twice. The curves use reported event times rather than assuming constant token consumption between events. Only ordinary passing runs completed within the deadline update the best score. Missing usage from the interrupted final turns is not imputed. Open the full-size PNG or PDF, or download the figure CSV.

Dollar cost was not measured per arm. I did not allocate an arbitrary fraction of a Pro monthly subscription to these three hours, or multiply Codex usage by API prices and label it a bill.
| Resource or expense | Recorded comparison | Unavailable measurement |
|---|---|---|
| LLM use | Parent/child and model-level token usage | Per-arm Pro allowance consumption or incremental charge |
| AWS allocation | Four instances per arm for three hours: 12 instance-hours | Invoice-reconciled dollars |
| Setup and final verification | Outside the 180-minute optimization window | Total per-arm expense including these stages |
The EC2 axis is a resource-time proxy: nine application-instance-hours plus three benchmark-instance-hours per arm. Because both arms have the same machine mix, it rescales the time axis and supplies no independent evidence of a monetary advantage. A dollar curve would need applicable machine rates, actual lifetimes, storage, and network charges. Cached input, uncached input, and output also cannot be treated as equally priced units.
Why did using the Codex SDK not produce a better result?
The official Codex SDK documentation, checked on September 13, describes the Python SDK as a JSON-RPC client for the local Codex app-server. The ISUCON task ledger and acceptance policy in this experiment were our own implementation.
This study found that our coordinated setup did not beat solo; it did not isolate a negative SDK effect. Both rerun parents used the SDK. The earlier comparison also changed too many controls together to answer the SDK-only question.
| Evidence or policy | Responsible layer | Supported interpretation |
|---|---|---|
| A completed review held a slot for 28 minutes; two launches were blocked | Our coordinator lifecycle | Proven capacity loss, not an SDK failure; score impact unknown |
| Two workers overlapped for only eight minutes | Task decomposition, dependencies, and dispatch | Limited realized parallelism; unoccupied time is not automatically waste |
| The parent used 87.9% of recorded tokens | Centralized decisions, integration, and review | Smaller worker context did not remove parent work; latency attribution is unmeasured |
| Team produced 23 ordinary passing measurements versus 40 solo | The complete implementation-to-measurement workflow | Fewer validated experiments, without identifying the cause of the score gap |
| Workers passed network-isolation checks; no logged direct parent implementation; pending candidates were bounded | Added policies and retained audit evidence | Each restriction's performance effect is unmeasured; unlogged effects cannot be ruled out |
The SDK let us control persistent threads, collect events and usage, and interrupt work at the deadline. Switching interfaces did not by itself improve hypothesis selection, independence between tasks, or review granularity. BrokenPipeError and TransportClosedError at cutoff were recorded during deadline shutdown; they are not evidence of an earlier failure explaining the whole trial.
The next proposed change is to terminate zero-diff review tasks correctly and count running workers separately from pending candidates, validated before another timed run. To isolate SDK overhead, keep the CLI binary, model, prompt, permissions, tools, and environment fixed, changing only direct CLI versus SDK delivery; measure first-response latency, tool round trips, and completion time. Scheduling changes belong in a separate comparison. These are proposed tests, not improvements already demonstrated here.
Conditions, accounting, and limits
Each arm used three c5.large application instances and one c4.xlarge benchmark instance, for eight independent EC2 instances in one availability zone. They came from the same reconstructed AMI rather than the unavailable bit-identical competition image. Seed source and deployed binaries were matched. Four preparation runs against the AMI's bundled binary were marked invalid and excluded; after rebuilding the seed, each arm received one valid baseline run. Solo's baseline passed with one nonfatal deduction.
The team recorded 46.72 million total tokens versus solo's 40.95 million. Its Astra parent accounted for 87.9% of that recorded total and reached a 244,705-token request, compared with the largest child's 53,083. Both root sessions were interrupted during their final turn at the deadline, so the totals are observed lower bounds and may omit that unfinished work; they are not billing records.
All eight machines changed boot ID during final verification, and all six running application hashes matched their selected builds. Both reboot benchmarks passed with zero deductions. Destruction was then verified for the eight instances and associated resources.
The sanitized rerun summary and score CSV are available for inspection. The earlier study's best in-window scores remain 1,621,980 for solo and 1,114,247 for the team. Because the rerun changed the SDK controller, broker, isolation, concurrency, ledger, parent role, and context handoff together—and hardware and search paths also varied—the lower absolute scores do not identify an SDK effect or support a general model ranking.
Initial study: 00:09–03:09 JST on September 13, 2026
Does adding coding agents make performance optimization faster? I gave one Astra agent and an Astra coordinator with GPT-5.6 Sol children the same starting code and three hours each in Codex.
After rebooting the servers, the solo run scored 1,636,308, compared with 885,334 for the team: about 1.85 times higher. Yet the team reached 500,000 points roughly 27 minutes earlier. Neither the final score nor a favorable midpoint tells the whole story.
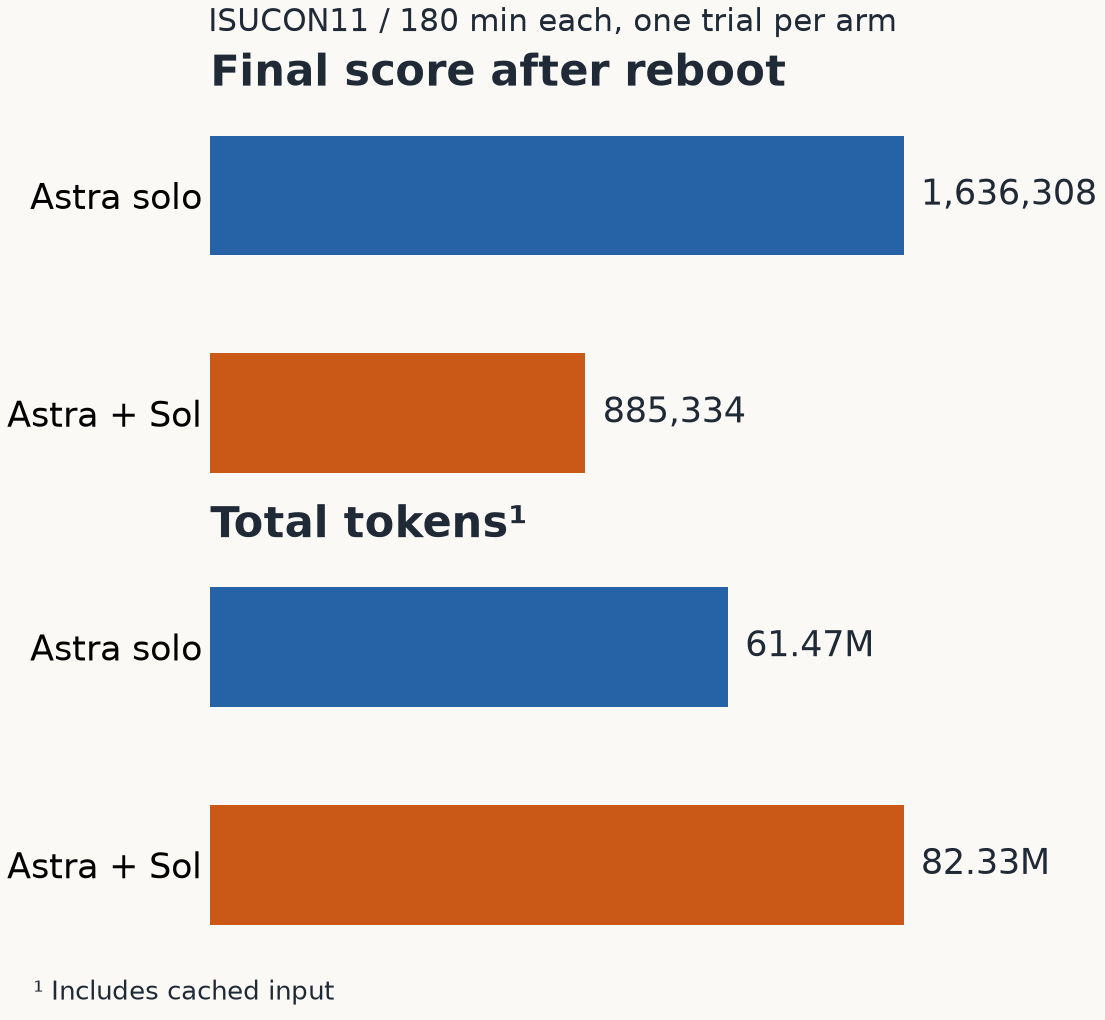
This article is based on the experiment report, experiments/codex-aws-compare/RESULT.md. The measured task was the ISUCON11 qualifier. Below, I use the original report figures and recorded execution data to examine scores, progress, tokens, and coordination.
What is ISUCON?
ISUCON is a competition in which participants improve an existing web service on limited server resources while preserving its required behavior. Changes can include reducing database queries, making computation cheaper, caching results, or redistributing work between servers.
A benchmark program simulates users, checks behavior, and assigns a performance score. The points in this article are its output, not raw requests per second. The scoring rules depend on the problem.
The measured problem was ISUCONDITION, from the ISUCON11 qualifier. It receives chair condition data and displays histories, graphs, and trends. Continuous writes compete with reads and aggregation, making databases, CPU work, caches, and server placement useful optimization targets. See the official application manual.
I wanted to compare the ability to deploy working changes and produce measured improvements, beyond producing convincing explanations.
Eight EC2 instances, two independent environments
Each arm received three competition servers and one benchmark server. The two environments ran simultaneously, without sharing application databases or benchmark machines.
| Condition | Solo | Coordinated team |
|---|---|---|
| Parent model | Astra / high | Astra / high |
| Children | None | GPT-5.6 Sol / high |
| Optimization time | 180 minutes | 180 minutes |
| Independent trials | 1 | 1 |
| Competition servers | 3 × c5.large | 3 × c5.large |
| Benchmark server | 1 × c4.xlarge | 1 × c4.xlarge |
| Starting code | Same commit | Same commit |
The model identifiers in the logs were gpt-6-astra and gpt-5.6-sol. Both used high reasoning effort and Codex CLI 0.154.0. The window was September 13, 2026, 00:09:35–03:09:35 JST. Setup and baseline measurement happened beforehand. This was an equal-time comparison, not an equal-token-budget comparison.
I matched the official ISUCON11 machine configuration: three c5.large competition instances and one c4.xlarge benchmark instance per arm. All eight ran in the same availability zone, each with 20-GB gp3 storage at 3,000 IOPS and 125 MiB/s. Benchmark machines were not upgraded during the trial.
The original official AMIs were unavailable. I used matsuu's reconstructed environment, matching the instance types, counts, and 20-GB gp3 storage. This was not a bit-identical recreation of the original competition image. Physical CPU models also differed despite matching instance types. Baseline scores were 1,678 and 1,874.
The shared starting commit was 0652d01d2699135605d8b634531d9873e9d71b2e. Application, SQL, public-file, certificate, and benchmark-executable hashes were checked across the environments. Neither arm received a previous optimized solution. Shared inputs and execution controls were frozen before the trial, and no optimization advice or results from the other arm were introduced during it.
Each CLI finished once about two minutes before the deadline. I resumed the same thread once and stopped it at the fixed deadline; this did not add an independent trial.
How the team was organized
The team received an explicit operating policy:
- Start with separate investigations of the database, APIs and requirements, and runtime behavior.
- Split implementation by testable hypothesis. Allow at most two implementation tasks and five children overall at once.
- Give implementation workers separate Git worktrees and focused starting context.
- Return summaries and files for the parent to integrate.
- Serialize deployment, initialization, benchmarking, and log collection within each environment.
The five-child limit was explicitly set by the AWS trial controller. It differed from the repository’s ordinary .codex/config.toml, which still contained a two-child limit from an earlier small comparison. The CLI ignored user configuration; agents were disabled for solo. The audit checked actual launch settings and native sessions, rather than inferring behavior from a configuration file alone.
A Git worktree provides a separate working directory for code changes. It does not isolate a database or a running service, so code isolation and environment locking were separate mechanisms.
The executor used the existing isucon-harness make aws-deploy and make aws-bench-only commands. It pinned each candidate commit and checked the running executable hashes on all three application hosts before measuring. Decisions used public manuals, benchmark output, and our own logs. Benchmark source code was not read.
How parent–child coordination actually works
There are three control layers. A Python controller owns trial timing and CLI settings, the Astra parent assigns work, and a Python executor serializes measurements on the servers. The controller does not decide which SQL query to optimize next; hypothesis selection and delegation belong to the parent.
| Component | Responsibility | Output |
|---|---|---|
controller.py | Launch both CLIs with fixed timing, models, common task, and team policy | Root threads, JSONL events, exit/resume records |
| Astra parent | Choose hypotheses, spawn and message children, review and integrate changes | Bounded child tasks and candidate commits |
| Sol children | Investigate, implement in dedicated worktrees, or review a diff | Conclusions, evidence files, commits, validated and unverified points |
executor.py | Accept a commit from the parent; deploy and measure under an environment lock | Run ID, score, messages, manifest, logs |
session_audit.py | Follow recorded parent–child relationships, models, tool calls, and usage | Actual child counts, overlapping turns, token totals |
1. Fix models and concurrency at launch
The following TOML excerpt summarizes the relevant settings passed by the controller. These were used with CLI 0.154.0 in this experiment; the excerpt alone is not a complete experiment setup.
model = "gpt-6-astra"
model_reasoning_effort = "high"

[agents]
enabled = true
max_concurrent_threads_per_session = 5
default_subagent_model = "gpt-5.6-sol"
default_subagent_reasoning_effort = "high"
The parent uses Codex’s collaboration.spawn_agent to start children and collaboration.send_message to send follow-up information. Children are instructed not to launch separate Codex CLIs, keeping work within a traceable thread tree. The record contains 24 spawn calls, 22 sends, and no rejected spawns.
2. Send a task contract, not the entire conversation
multi-policy.md requests fork_turns="none" for every child. Each receives an objective, current baseline commit, hypothesis, owned paths, observation references, required artifact, validation method, and prohibition on external mutations. This illustrates that handoff format; it is not a verbatim historical prompt.
Objective: Test whether graph retrieval can read less data from the DB
Baseline: The current commit specified by the parent
Scope: Graph retrieval only; preserve writes, authorization, and scoring rules
Evidence: SQL logs from this trial's run and the relevant handler
Work: Create a dedicated worktree at the baseline; fetch only required columns
Return: Commit, evidence, local validation, unverified points, and risks
Do not: Deploy, change remote DBs, restart services, or run benchmarks directly
Children return short responses and files, and the parent reads the relevant evidence. Commits, diffs, observations, and task notes carry shared state; there is no continuous synchronization of everyone’s conversations into a shared memory. Sharding work actually used separate design, implementation, and fresh-review stages. The implementation child owned application condition routing, while the parent prepared configuration and initialization for the two database hosts. The parent integrated both into one candidate, and a separate child reviewed SQL, consistency, and caching before measurement.
3. Integrate centrally and overlap independent work with measurement
The policy allows at most two independent implementation tasks and one integrated but unmeasured candidate. When a child returns a commit, the parent reviews its diff against the hypothesis and API contracts, then integrates it onto the current baseline. A spare child slot can be used for a focused review.
When the baseline changes, the policy calls for notifying only children whose paths or assumptions are affected, sending the new commit and changed conditions. Dependent candidates must be brought onto the current baseline and measured after integration. Other independent investigation, implementation, or review can continue during a benchmark. As the timeline shows, this overlap was underused in the actual trial.
4. Route server operations through one entry point
The parent submits a candidate with ./experiment.py candidate --commit COMMIT_SHA --label SHORT_DESCRIPTION. Read-only runtime observations use the same client’s inspect operation. Children return candidates; the parent is the sole evaluator operator under the policy.
For each environment, the executor holds flock across the candidate snapshot, baseline configuration reset, candidate operations, build/deploy, running-binary verification, benchmark, and evidence collection. It also checks for a previous benchmark still running. The lock belongs to this execution path, rather than to an LLM conversation that may pause or resume.
Scores and pass status are parsed from execution output. Execution errors or missing required evidence produce an incomplete record. An interrupted benchmark whose remote cleanup cannot be established can quarantine the environment, blocking the next experiment. The parent’s final prose is not the source of the official score.
The code controls CLI settings, deadlines, and the locking and records of operations routed through the executor. The semantic two-implementation limit, child write ownership, and prohibition on direct SSH depend on instructions and retrospective audit. They are not all enforced by per-child operating-system permissions. That distinction bounds what “controlled” means in this experiment.
The team led in the middle; solo overtook it late
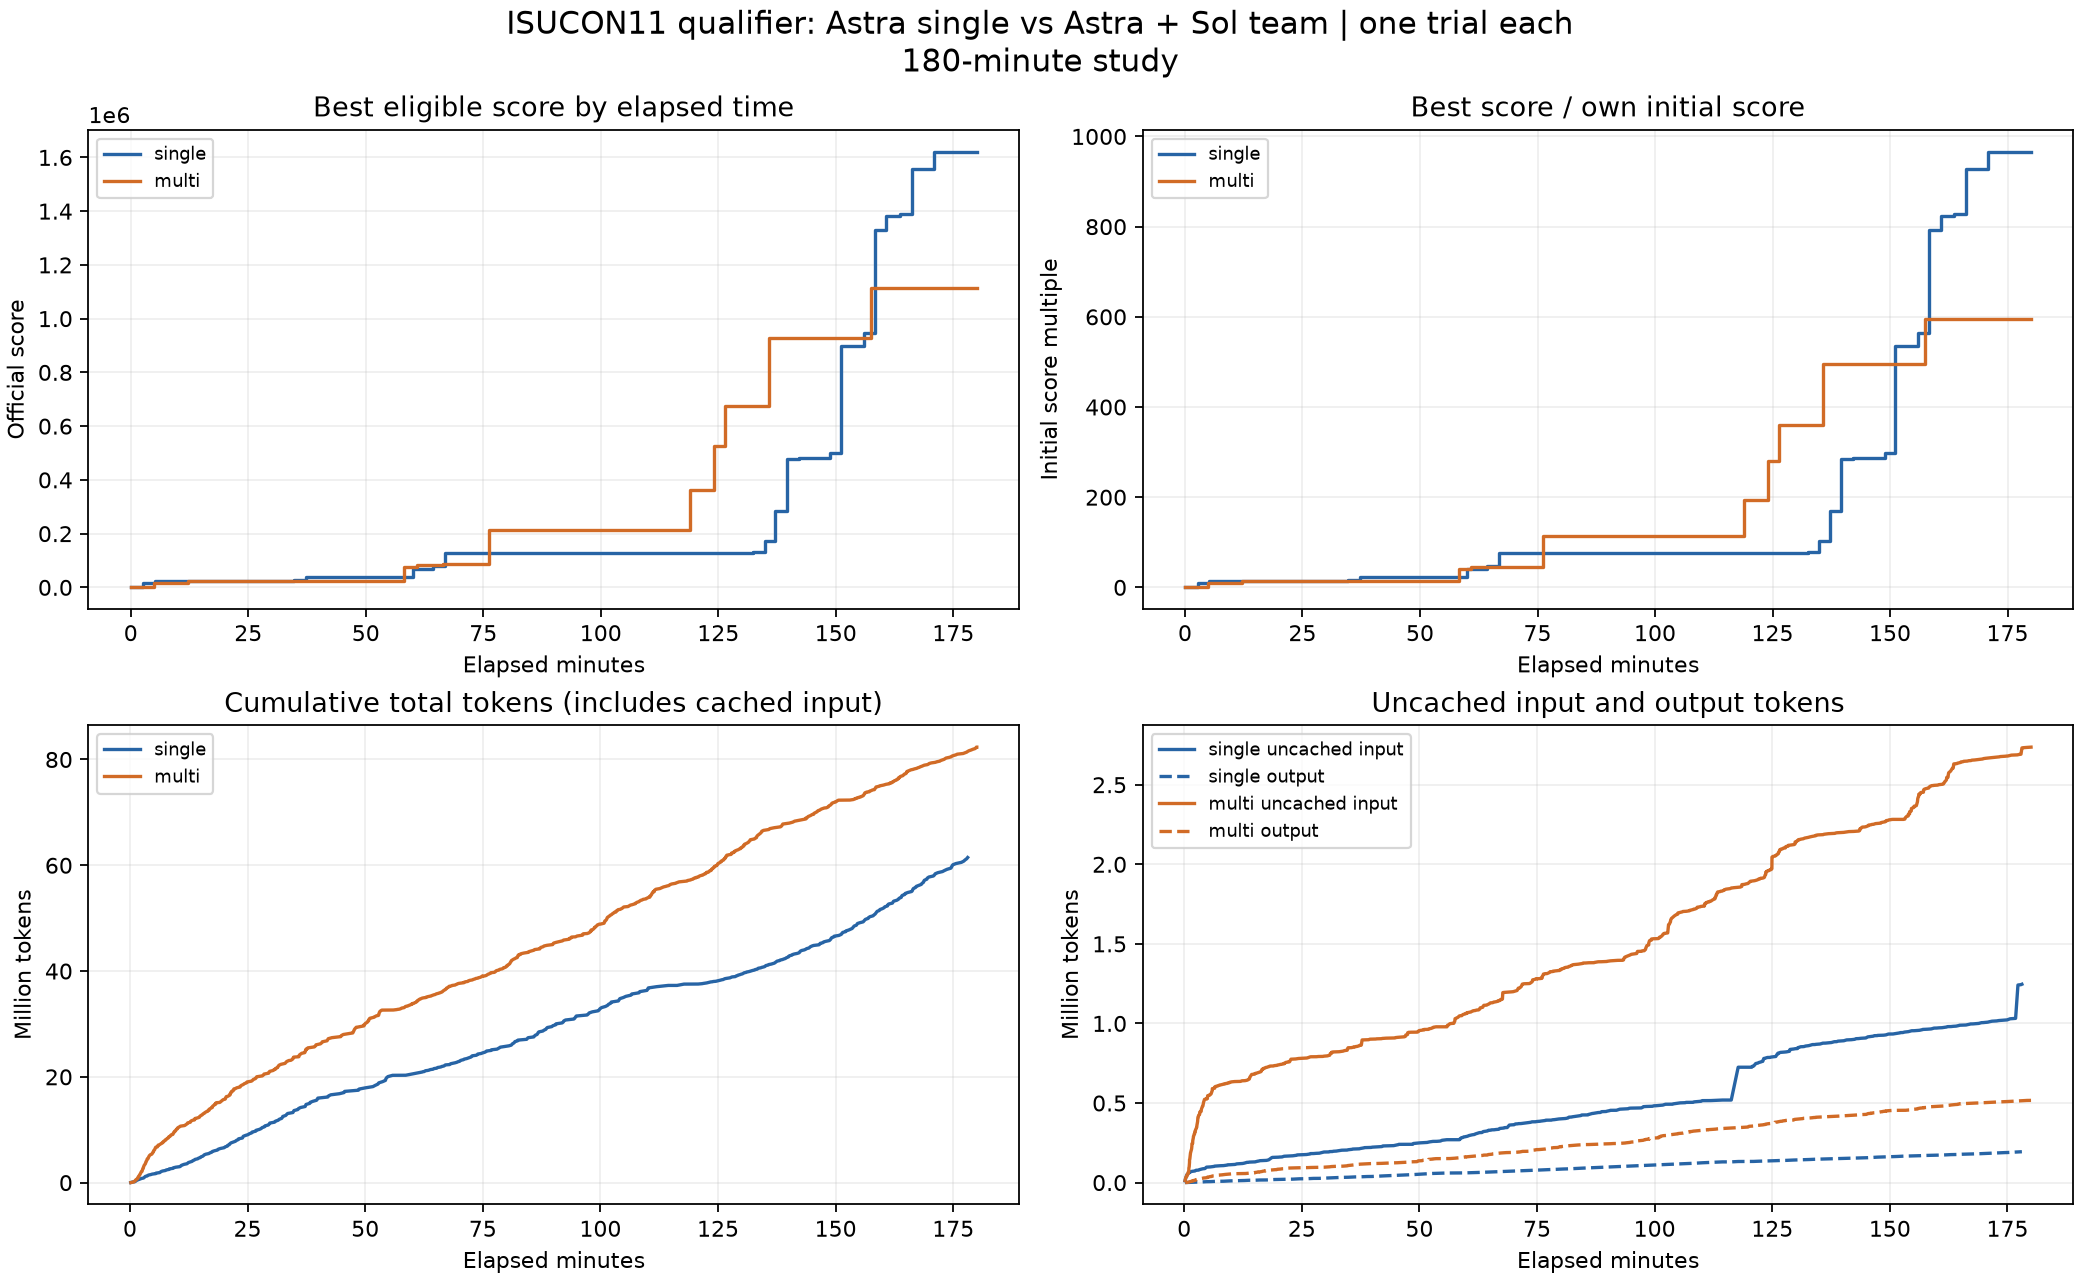
Full-size PNG / PDF. This is the original report figure, unchanged. Blue denotes solo; orange denotes the team.
The top left shows the best normal passing score observed by each time; the top right divides that score by each arm’s own baseline. Both exclude diagnostic profiling runs, failures, and the post-window reboot benchmark. The bottom left shows cumulative tokens including cached input; the bottom right separates uncached input and output.
| Threshold | Solo | Team |
|---|---|---|
| 10,000 | 0:02:43 | 0:04:51 |
| 50,000 | 1:00:02 | 0:58:14 |
| 100,000 | 1:06:47 | 1:16:09 |
| 250,000 | 2:17:10 | 1:58:54 |
| 500,000 | 2:31:05 | 2:04:05 |
| 1,000,000 | 2:38:23 | 2:37:29 |
The team reached 500,000 about 27 minutes sooner. At one million, its lead had narrowed to 54 seconds. Solo then made larger gains.
Integrating the running best passing score over time and dividing by 180 minutes gives 316,651 for solo and 370,073 for the team: a 16.9% team advantage. This summarizes how early high scores were observed. It does not establish the service’s actual performance at every instant or the repeatability of those scores.
The selected solutions differed, too.
| Area | Solo selection | Team selection |
|---|---|---|
| Writes | Grouped transactional LOAD DATA; respond after commit | INSERT all conditions in transactions of 100 records |
| Placement | app3 hosts the DB; app2 handles ingestion; app1 owns metadata/trend | Deterministic condition sharding across app2/app3; metadata on app2; apps on all three |
| Reads | Condition index, fewer columns, 16-second trend cache, reused Gob payloads | Condition index, graph projection, 250-ms trend cache, icon LRU/ETag |
| Selected commit, shortened | 0e2a05019f66 | 9e7dae4eee86 |
This compared optimization paths as well as agent counts, rather than the time to produce an identical patch. Solo gained late through trend TTL and write placement; the team gained in the middle through database sharding and graph projection.
Solo's final trend cache lifetime was 16 seconds; the team's was 250 milliseconds. The public requirements permit delayed condition updates in the trend view. This is an observed difference in implementation, but I did not isolate cache lifetime as the sole cause of the outcome.
Peak scores and final reboot scores are different measurements
| Measurement | Solo | Team |
|---|---|---|
| Best normal score within three hours | 1,621,980 | 1,114,247 |
| Pre-deadline confirmation of the selected commit | 1,608,134 | 654,392 |
| Final score after reboot | 1,636,308 | 885,334 |
The first baseline loads started at 23:48:04 JST for solo and 23:48:01 for the team on the previous day. Solo reached its timed peak 3:12:23 after that first load, or 2:50:52 into optimization; the team took 2:59:03 and 2:37:29 respectively. Final reboot runs completed at 3:23:42 and 3:23:46 from the first load, outside the optimization window. No idle intervals were compressed.
“One trial per arm” means one three-hour optimization attempt. Each attempt contained successive candidate measurements, including confirmation of the selected version.
Following the ISUCON11 manual, I used the post-reboot benchmark as the final score. Both passed, although the team had nine transport errors and 71 timeouts. Its output was 885334(885350 - 16): the direct penalty was only 16 points, so penalties alone do not explain the score gap.
All four hosts per arm changed boot IDs, and the three application executable hashes were checked again after reboot. Solo had zero penalties and zero timeouts, but its stderr included a Force ending loadWaitGroup warning, which was retained.
The team varied substantially on the same selected commit. Rebooting cannot be identified as the only cause of the drop. A further persistence check—rebooting again and reading back data written during the final benchmark—and a browser equivalence replay were not performed. The runtime evidence establishes a passing benchmark after reboot, not completion of every official follow-up check.
Count the children's tokens, too
| Usage | Solo | Team parent | Sol children | Team total |
|---|---|---|---|---|
| Input | 61,273,760 | 54,406,272 | 27,412,204 | 81,818,476 |
| Cached input | 60,027,392 | 53,330,048 | 25,752,320 | 79,082,368 |
| Uncached input | 1,246,368 | 1,076,224 | 1,659,884 | 2,736,108 |
| Output | 193,901 | 208,014 | 308,477 | 516,491 |
| Reasoning output | 96,503 | 103,446 | 108,485 | 211,931 |
| Total | 61,467,661 | 54,614,286 | 27,720,681 | 82,334,967 |
Cached input is a subset of input. Total is input plus output; cached tokens are not added again. Reasoning output is likewise counted within output.
The team's parent used less input than solo. Including the children, however, total tokens increased by 34%, uncached input by about 2.20 times, and output by about 2.66 times. Reducing the parent's context burden did not reduce the system's total usage.
The team parent used 11.2% less input, but recorded compactions were two for solo and three for the team parent. Peak request input was 244,601 tokens for solo and 218,111 for the team parent; one research child reached 193,828. These are recorded request sizes, not model context-window capacities.
Fresh context did not guarantee small requests. All 24 children had references to reading the manual, so repeated onboarding remained part of the workload.
Usage came from all 26 experimental threads—one solo thread and 25 team threads—in native session logs. Preparation, observer, and post-experiment code-review agents were outside these totals. The deadline interrupted the parents' resumed turns, leaving incomplete turn records. These totals reflect recorded usage, not a finalized bill covering any unreported provider-side processing. I did not assume model prices to convert them into dollars.
Twenty-four children did not mean continuous parallel work
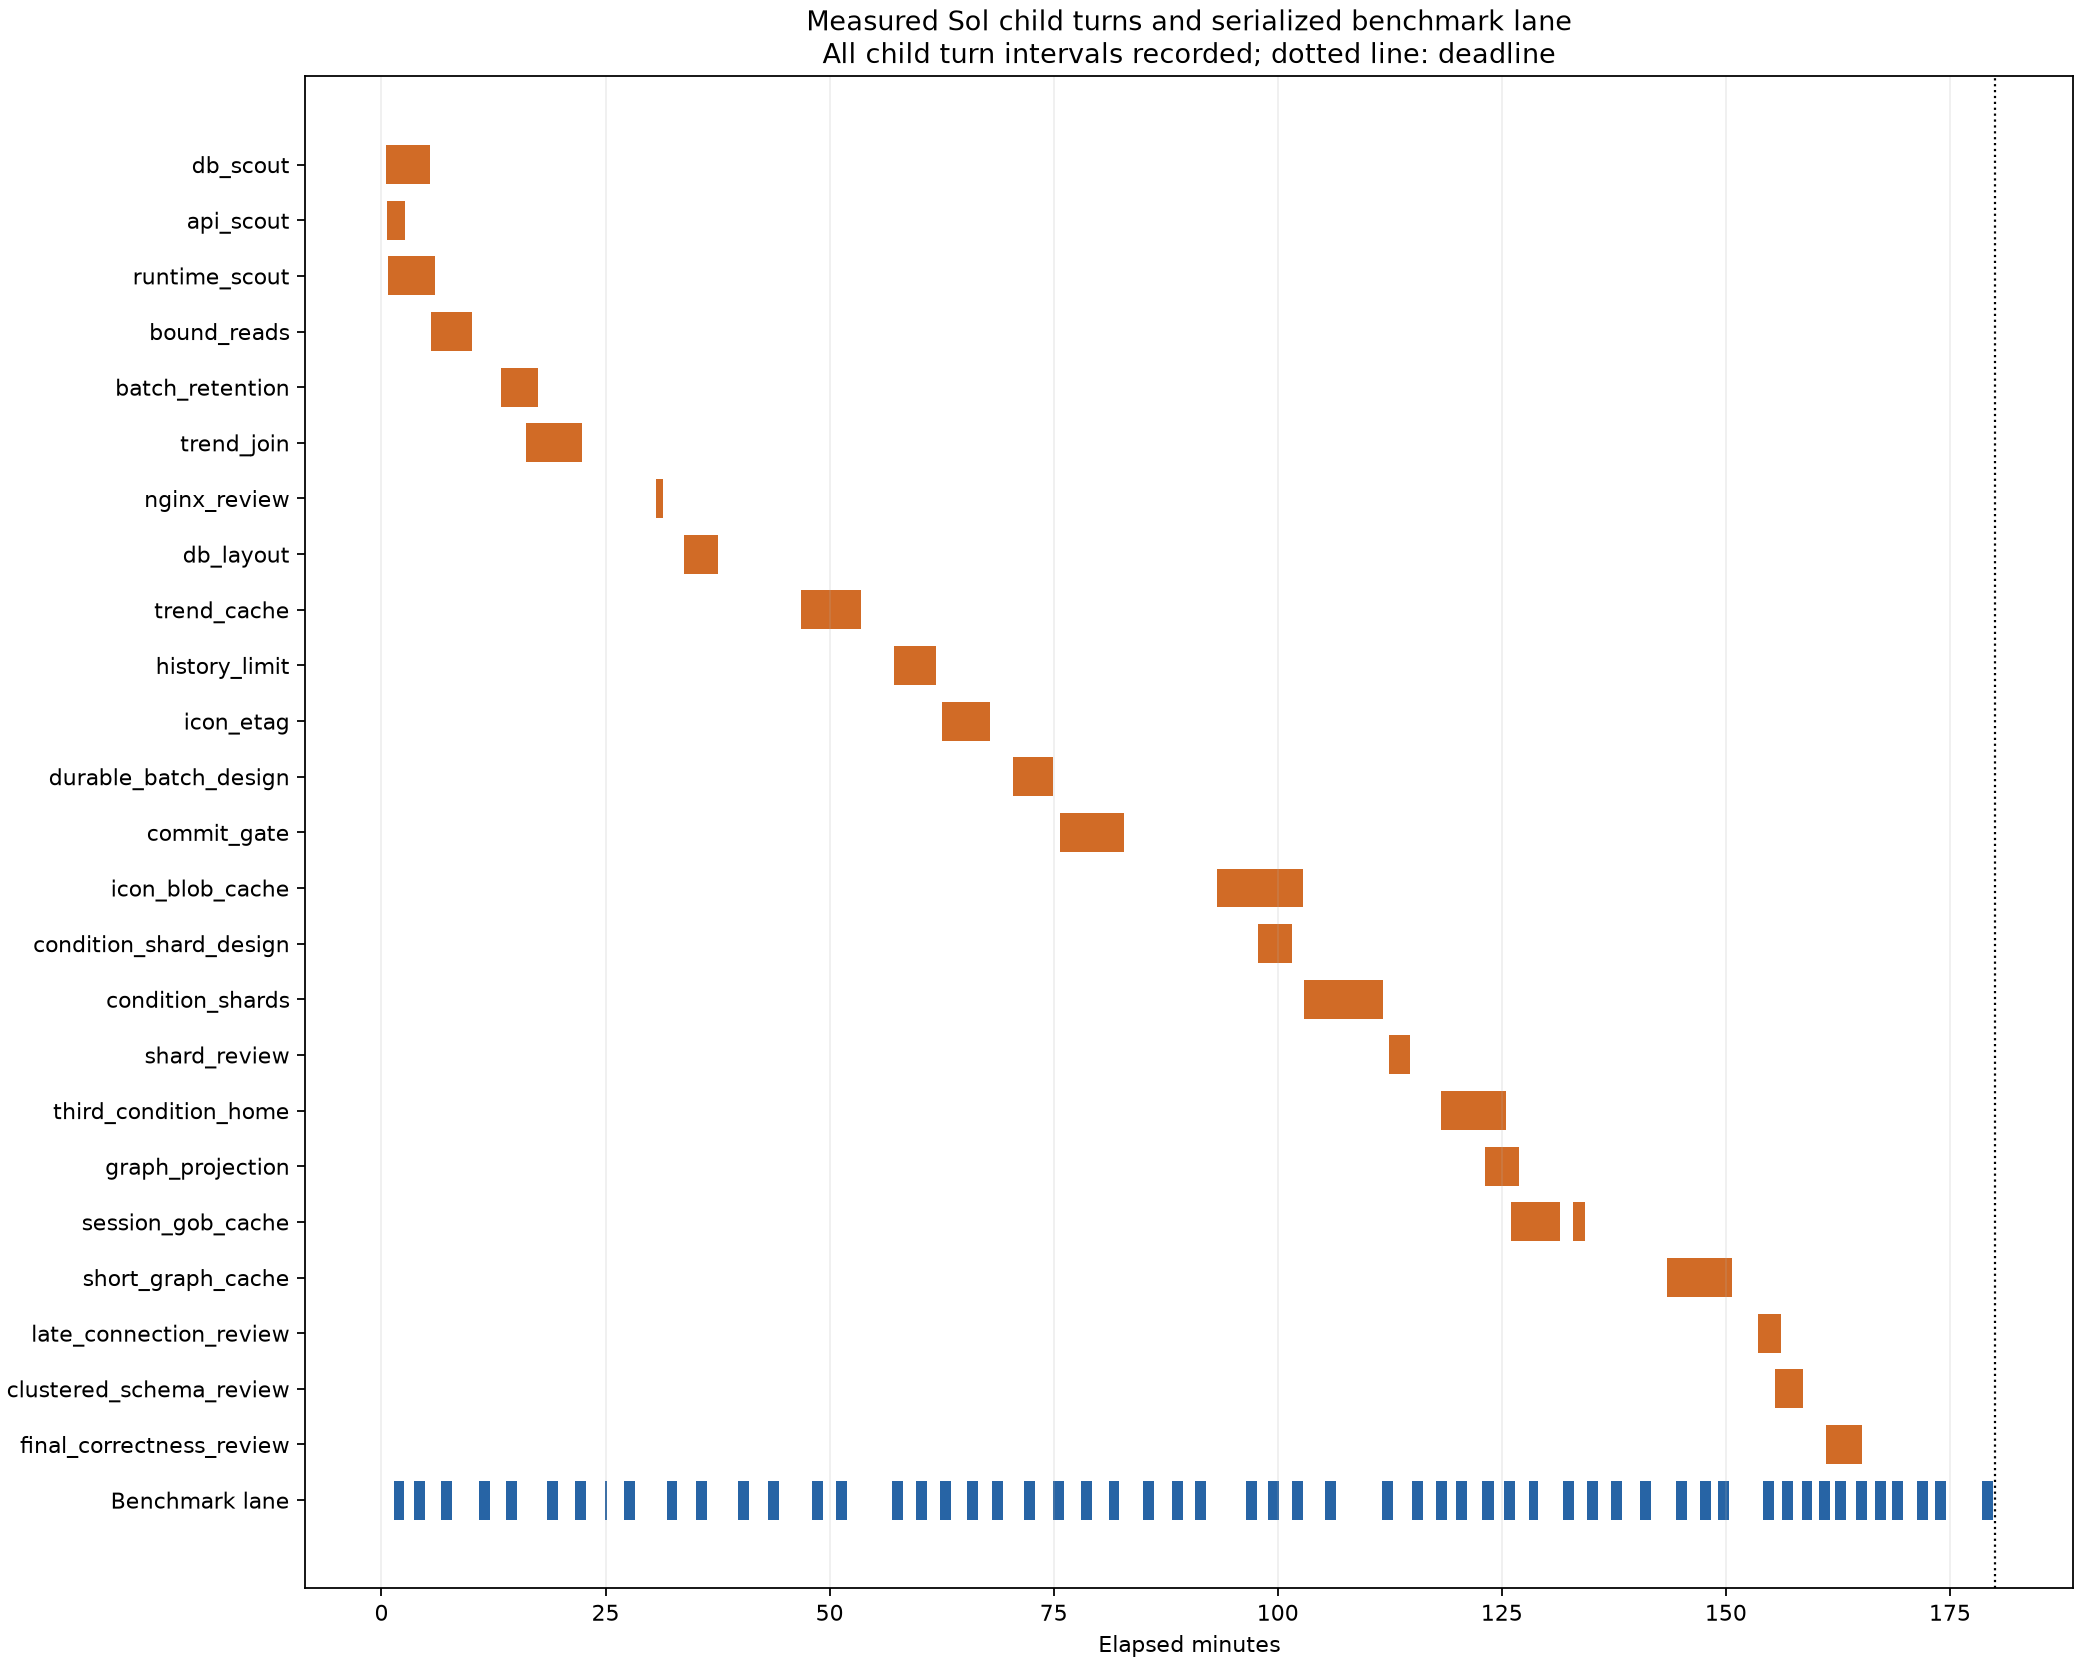
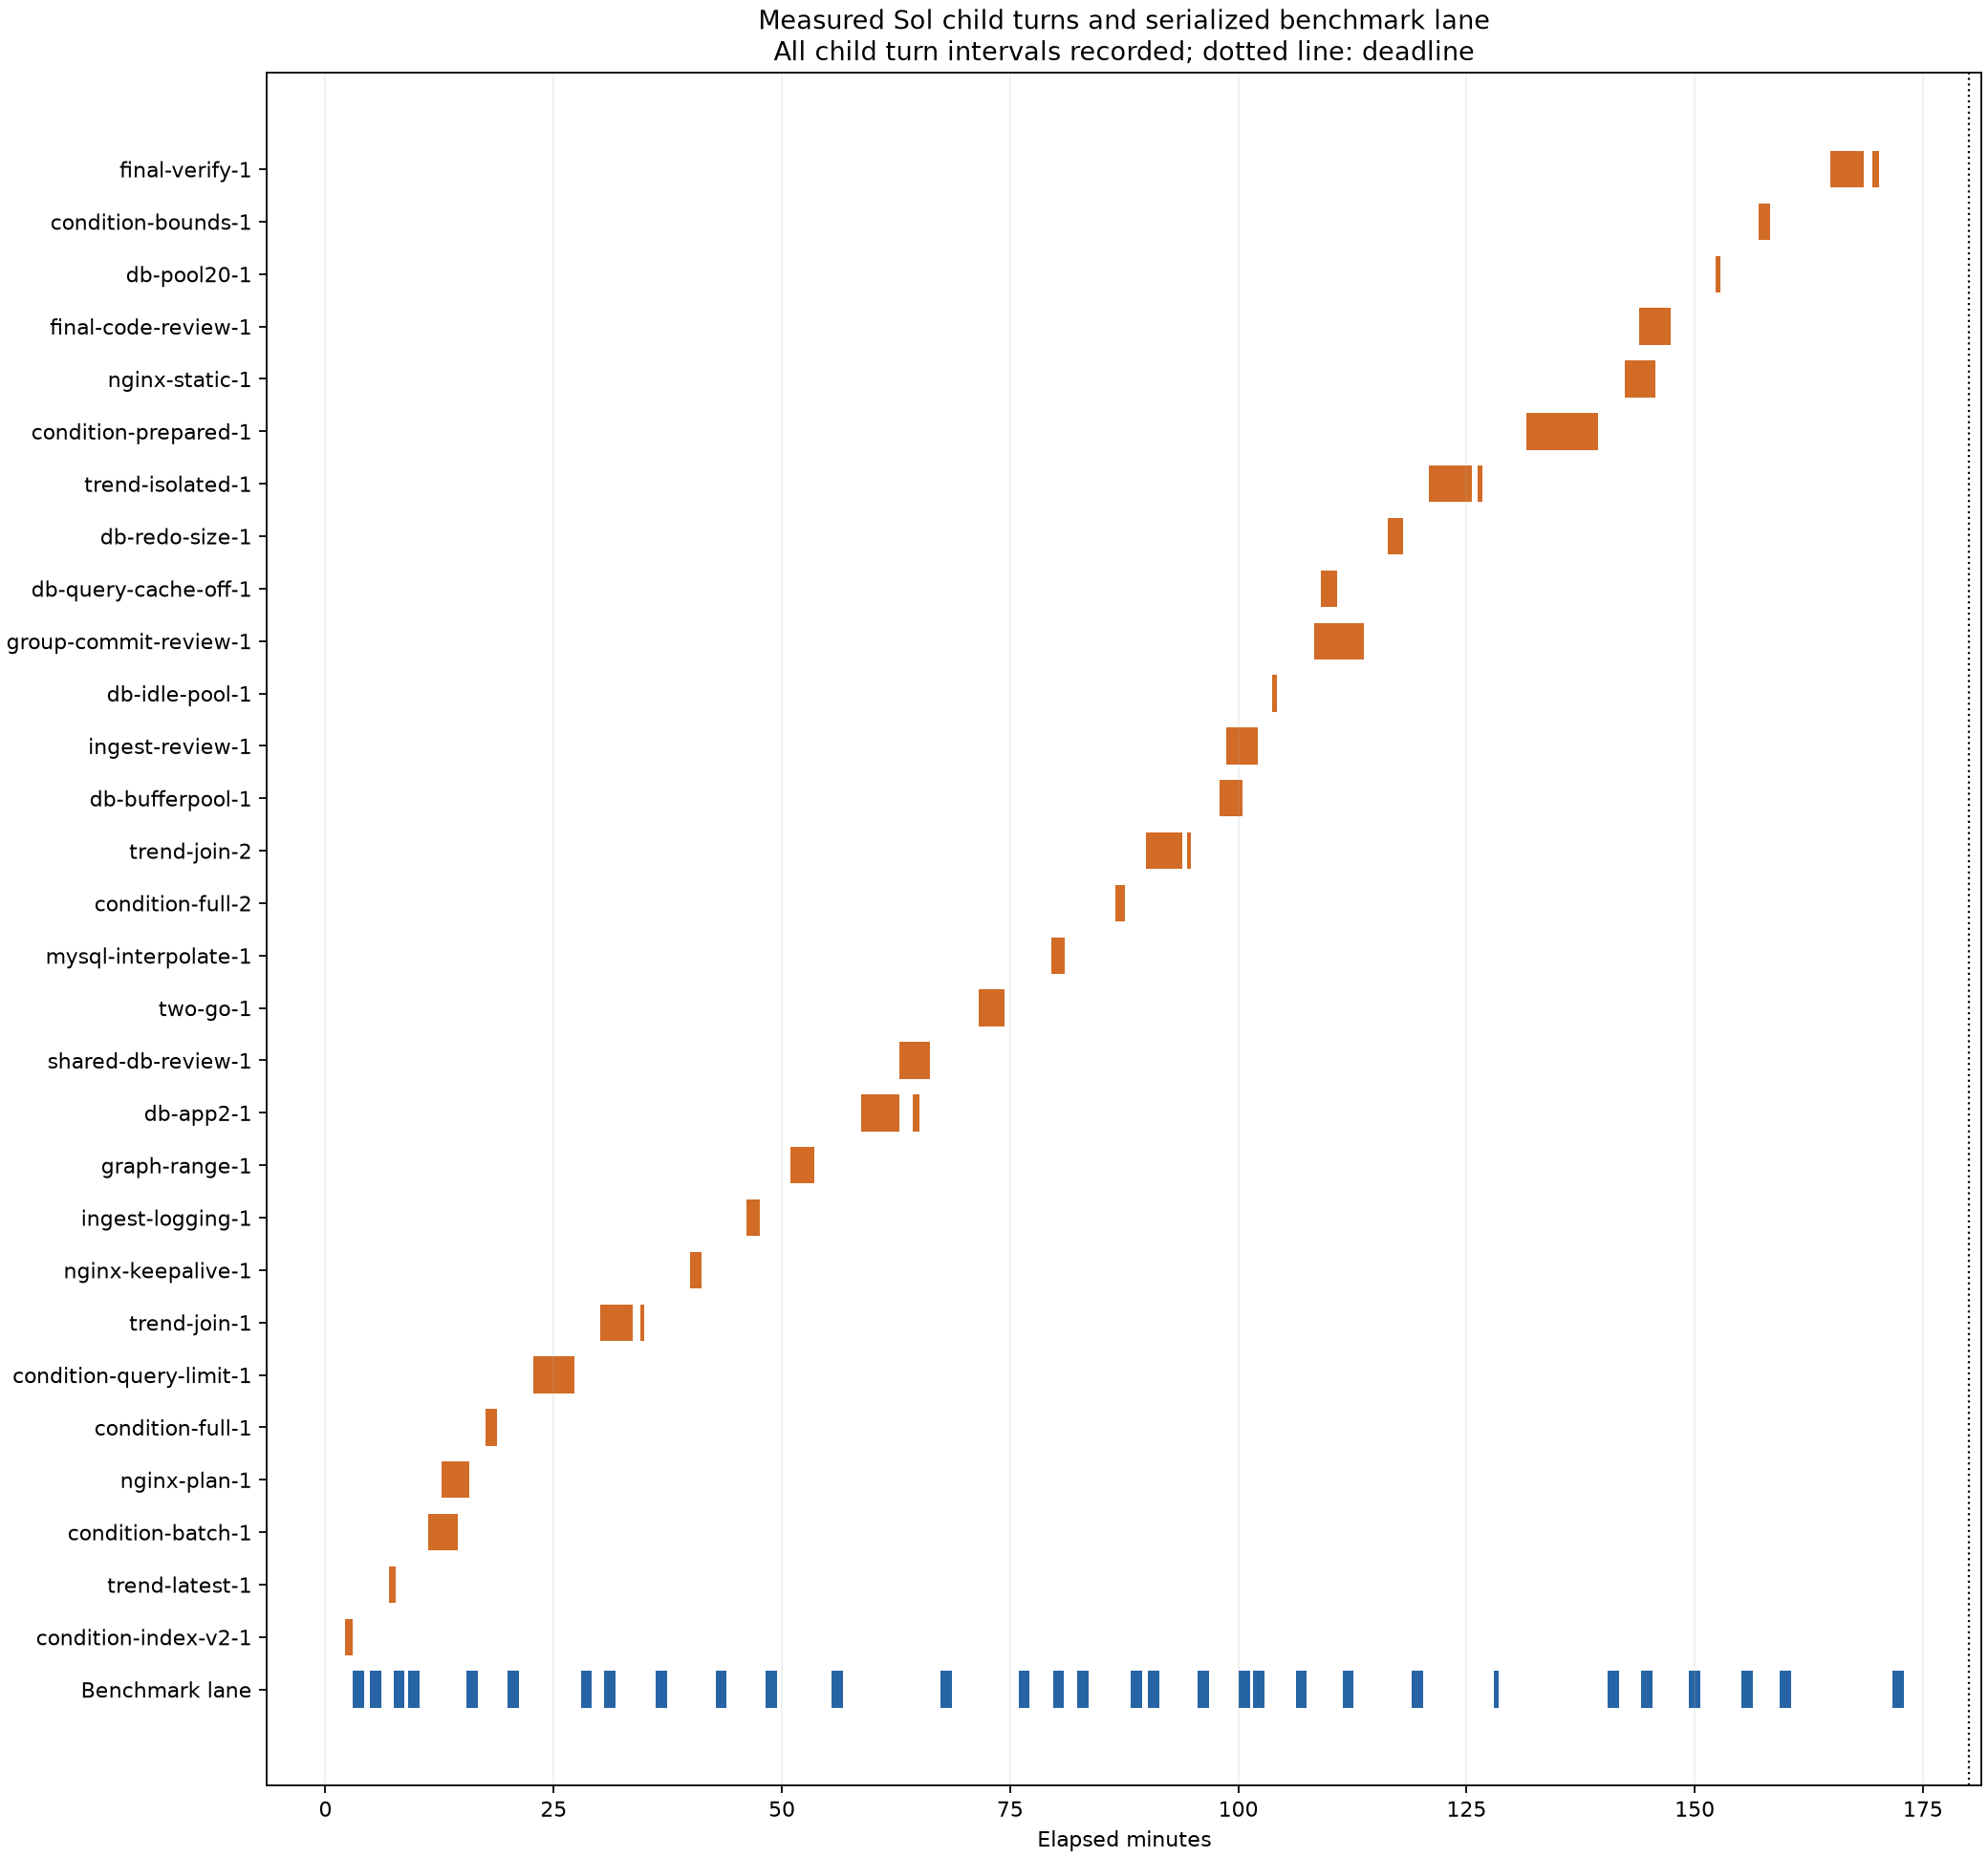
Full-size PNG / PDF. Orange marks child turn intervals; the bottom blue lane marks benchmark runs. The three initial investigations overlap, but much of the later activity uses one child at a time.
The logs established that:
- Solo launched no children. The team launched 24 child threads, all GPT-5.6 Sol with high reasoning effort.
- Peak concurrent child activity was three. No grandchildren were launched.
- All children used
fork_turns="none". The recorded commands showed separate implementation worktrees, with no counterexample to the two-implementation limit. - There were 25 completed child turn intervals. No child was active for 76:49, one for 88:39, and two or more for 14:32.
- Summed child activity was 119:37, with an average active child count of 0.665.
“Active” here means a child turn interval, including tools and waits. It is not measured GPU inference time.
Model selection, counts, and execution intervals were auditable. Worktree ownership and meaningful task independence were not enforced as operating-system security boundaries. Observed compliance is narrower than mechanical enforcement.
| Experimental throughput | Solo | Team |
|---|---|---|
| Candidate executions | 56 | 56 |
| Normal passes | 50 | 46 |
| Diagnostics | 4 | 8 |
| Failures | 2 | 2 |
| Normal passes per hour | 16.67 | 15.33 |
| Numerical best-score updates | 24 | 11 |
| Executor occupancy | 87.25 min | 85.54 min |
Total lock waiting was approximately 0.003 seconds per arm. The record does not indicate a continuously saturated executor. Candidate generation, investigation, and integration could be coordinated better, although the remaining time cannot all be classified as wasted waiting. A numerical best-score update is also not a statistically established improvement.
Failures were retained: bounded-history-reads and grouped-durable-writes for solo; trend-single-query and three-durable-homes for the team. Looking only at successful candidates would hide part of the work.
The team parent spent about 17.4 minutes in sleep calls, including waits for children and benchmarks. It also implemented a late pool change itself, rather than acting exclusively as a coordinator. These observations describe the workflow; none independently proves the cause of the final score gap.
What I would change next
For this workload, the result supports keeping Astra solo as a baseline and using children selectively for independent investigation and review. The team's earlier progress is still useful evidence.
I would make the pipeline more explicit: while the parent deploys and measures, children prepare one or two independent hypotheses for the next experiment. A concise shared map of the requirements should reduce repeated reading, while preserving links to the relevant original text. Near the deadline, I would reserve time to examine errors and repeatability rather than continue adding structural changes.
Those are proposed improvements, not a measured winning configuration. This experiment tested one team setup with an efficiency policy, not an established optimum for multi-agent orchestration.
The fixed three-hour deadline also means this was not a run to the harness’s usual optimization plateau.
With one trial per arm, hardware differences, unequal baselines, and different optimization paths, the result does not establish a universal model ranking or a multiplier transferable to other workloads. The operating metric I want to improve is how many useful changes we can measure correctly within a fixed time, rather than the cumulative number of agents launched.
Data and cleanup
The summary JSON and candidate score CSV accompany this article. The opening summary figure was generated from recorded measurements. The four-panel chart and child timeline are unchanged PNG/PDF copies from RESULT.md; their SHA-256 manifest is included. The CSV includes diagnostics, failures, and post-reboot runs; its eligible column identifies normal passing runs within the time window.
I retained 70,450 files, about 7.50 GB of logs, commits, patches, configuration, and parent/child sessions locally, with a per-file SHA-256 inventory. The public data excludes AWS connection details and raw sessions. AWS API checks confirmed that all eight EC2 instances were terminated, all eight associated EBS volumes were gone, and no dedicated security groups or key pairs remained. Destruction and cleanup verification completed at 03:14:14 JST on September 13, 2026.