The latest three-hour Codex experiment on ISUCON14 produced a best passing score of 133,401 with Astra working alone and 48,123 with Astra coordinating GPT-5.6 Sol workers. An older tuning record associated with Claude contains a run that started within its first three hours and scored 537,835. The observed gap is large. It is also not a fair model ranking.
The three records differ in hardware, MySQL durability, timing semantics, orchestration, and recoverable evidence. The old application's final commit is missing, and “Claude Opus 5 (1M context)” appears only in a commit trailer. There are no saved model responses, token records, agent counts, or prompts for that run. What the evidence supports is a comparison of optimization paths under different conditions. It does not support “Claude is four times better than Codex at ISUCON14.”
This article asks a more useful question: which observed differences could plausibly explain the score gap, which ones cannot, and what should be tested next?
What ISURIDE asks you to optimize
ISUCON is a competition about speeding up an existing web service on limited servers while preserving required behavior. ISUCON14's ISURIDE is a ride-hailing system for chair-shaped vehicles. Location updates, matching, trip-state notifications, payments, histories, and owner sales calculations run together. Repeated reads or one-row-at-a-time writes can block progress, making the work required to complete one ride a useful unit of analysis.
The measured result
The new experiment ran on September 14, 2026 from 00:16:12 to 03:16:12 JST. Each arm had an independent AWS environment, the same initial application commit, and exactly 180 minutes, including stops and waits. The trial code did not receive the historical solution or its optimization notes, and the benchmark source was not read.
| Metric | Astra solo | Astra + Sol |
|---|---|---|
| Baseline | 1,117 | 971 |
| Best passing score completed within 180 minutes | 133,401 | 48,123 |
| Improvement over baseline | 119.43× | 49.56× |
| First score above baseline | 2.74 min | 5.69 min |
| First 10,000 | 7.83 min | 19.91 min |
| First 50,000 | 35.91 min | Not reached |
| First 100,000 | 94.90 min | Not reached |
| Candidate manifests within the window | 56 | 27 |
| Ordinary measurements, pass / fail / unfinished | 47 / 0 / 1 | 21 / 0 / 1 |
| Diagnostic measurements | 8 | 5 |
| Post-reboot score | 126,549 / pass | Not obtained |
The production benchmark ran on ECS Fargate. This study used an EC2 benchmark host as a proxy and limited the benchmark process to 8 GiB of memory, so it did not recreate the production environment exactly.
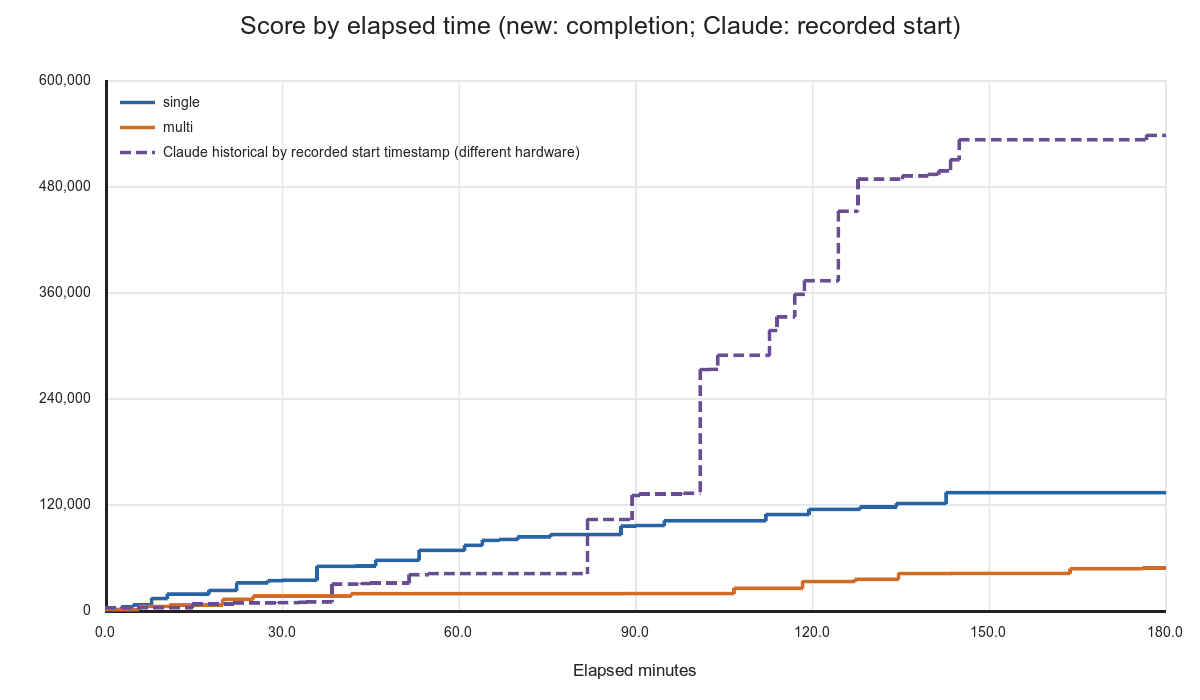 Best passing score over elapsed time for Astra solo, Astra with Sol workers, and the historical Claude-associated record
The purple historical line needs a qualification that the blue and orange lines do not. The old ledger saved a timestamp captured before log initialization and benchmark execution. Its 537,835-point run started at 2:56:47, but the saved data cannot prove that it finished before 3:00:00. The last pass whose start time fell inside that boundary was 509,033 at 2:59:13. The new experiment uses benchmark completion time for its deadline.
The old baseline was 2,883, 3,465, and 2,925, averaging 3,091. A 517,267-point run started just outside the boundary at 3:00:33. The headline 965,214 was the best of three final passes—962,951, 965,214, and 930,899—after about 5 hours 12 minutes of compressed working time; the single-run best was 983,892 and the post-reboot pass was 966,809. The wall-clock interval was 13:55:04 because an 8:46:12 overnight gap was compressed to three minutes. These are successful tuning records, not three-hour Codex controls.
The historical path reached broader changes early
One plausible explanation visible in the old ledger is the order in which broad bottlenecks were removed. Before the three-hour boundary, the record labels a candidate that held rides and state transitions in process at 103,038 points after 1:21:51, an SSE notification candidate at 272,757 after 1:41:00, and removal of intermediate rides updates at 488,400 after 2:07:47.
Those labels describe candidates that were measured. They are not isolated effect estimates: most were run once, the exact candidate commits are absent, and surrounding changes may also have contributed. Still, the sequence shows that the historical path reached state management and notification/write-path redesign earlier and then compounded those changes.
The new solo selection implemented related ideas: indexes, persistent aggregates, batch matching and coordinates, batched notification acknowledgements, SSE wakeups, direct notification routing, authentication caching, joined history reads, idempotent payment retries, and nginx tuning. The coordinated selection included indexes, a persistent distance aggregate, batch matching, SSE hubs, N+1 removals, and DB pool tuning. Solo accumulated 39 relevant commits; the coordinated selection accumulated 13.
Two later historical improvements cannot explain the three-hour gap. The DB pool limit of 200 was recorded at 3:20:52, after the boundary. Score-aware matching first appeared around 4:55–5:00, raising a late run from roughly 923,000 to the final range after tuning its fixed-overhead term. It may explain part of the historical five-hour finish, but it cannot explain why the older path was already around half a million by the end of hour three. The benchmark-machine upgrade also came later, before the 896,828-point stage around 4:02, so it cannot explain the early lead either.
Hardware and durability remain unmeasured confounders
The new arms each used three c5.large application instances and one c5.2xlarge benchmark instance. The historical setup used three c7a.large application instances and initially a c7a.2xlarge benchmark instance, later upgraded to c7a.4xlarge. Different EC2 generations and CPU platforms can change application, database, and benchmark throughput. No matched hardware ablation was run, so the size of that effect is unknown.
The MySQL settings also differ. The historical setup recorded innodb_flush_log_at_trx_commit=2; both new selected versions retained the default value of 1. MySQL documents this variable as a tradeoff between commit durability and the performance available when commit-related I/O is rearranged or batched: value 1 writes and flushes at each commit, while value 2 writes at commit and normally flushes on a timer. With value 2, an OS or kernel failure or a power loss can lose transactions whose log has not reached durable storage; a mysqld process-only termination is not necessarily the same failure mode. See the MySQL 8.0 reference.
This is a plausible latency and durability confound, not a measured explanation of the score gap. The experiment did not isolate the setting. The historical orderly reboot succeeding also does not prove survival of an OS failure or power loss.
Server use is another concrete difference. Both new selected versions placed nginx, the Go API, and the matcher on app1, MySQL on app2, and no serving role on app3. Across 17 sampled intervals per host, average CPU busy was 47.3% / 78.3% / 1.7% for solo and 39.3% / 85.1% / 2.2% for the coordinated arm. The database was busy while app3 was nearly idle.
The historical final configuration assigned Go to app1, MySQL to app2, and nginx, TLS termination, and static files to app3. The retained harness setup and operations source verify that topology. The optimized Go and SQL source is what is missing, so the complete application behavior cannot be compared. The machines also differ, and the old labels combine topology with other changes. The data does not show that merely moving nginx to app3 would reproduce the gain.
Coordination reduced measured throughput in this run
The coordinated arm completed 21 ordinary passing measurements, versus 47 for solo, and produced 27 candidate manifests versus 56. Two owner interventions recovered coordinator failures: one task was stranded after preparation failed, and one revised candidate hit a non-fast-forward reference collision. The clock was not extended. A final readiness race also stopped the post-reboot benchmark: Go first started before MySQL was ready, exited, and was restarted by systemd just after the identity check had already failed. Later read-only inspection found the correct selected binary running, but no score was measured and reboot durability remains unverified.
The team created 27 child threads across 31 worker invocations, with an observed maximum concurrency of two. Every invocation was audited as Sol/high, and all 31 passed the isolation preflight. These were coordinator-managed Codex CLI workers rather than native subagents. Session-audit intervals were incomplete, so the record does not prove concurrency coverage for every instant.
Each worker received a short packet with its hypothesis, baseline commit, owned files, artifact, and validation method. A dedicated clone and sandbox restricted writes, Git metadata, and tool network access. Workers returned a diff and evidence; Astra compiled and reviewed it, then the coordinator recorded the candidate commit for measurement. Adoption depended on the measurement result. Integration and decisions remained with the parent.
Token totals reinforce the throughput finding without explaining its cause.
| Recorded token metric | Astra solo | Astra + Sol |
|---|---|---|
| Input, including cached input | 58,281,036 | 68,271,152 |
| Cached input | 56,694,016 | 65,778,304 |
| Uncached input | 1,587,020 | 2,492,848 |
| Output, including reasoning | 220,579 | 386,886 |
| Total input + output | 58,501,615 | 68,658,038 |
| Cached share of input | 97.28% | 96.35% |
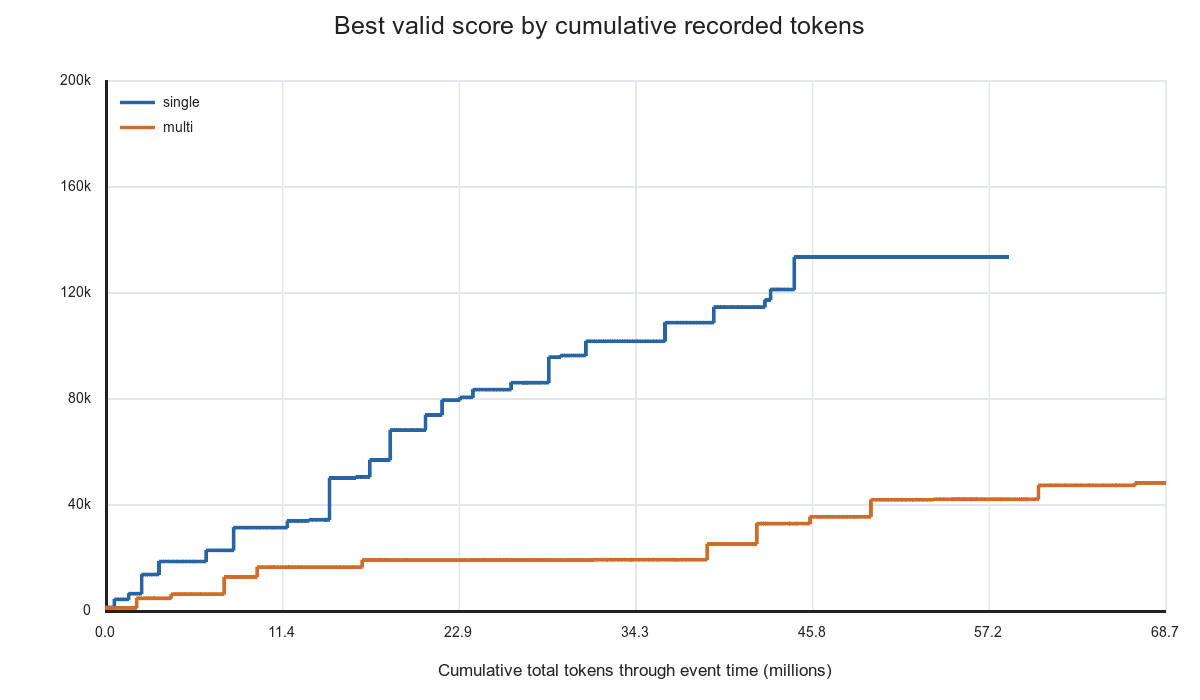 Best passing score against cumulative recorded tokens
The coordinated parent's 62,367,072 tokens alone exceeded the solo arm's entire 58,501,615. Children added 6,290,966, bringing the coordinated total 17.36% above solo. “Best score divided by recorded tokens” favors solo by about 3.25×, but that is only a rough processing-volume ratio. Cached input, uncached input, and output do not have equal economic meaning, and the totals are not API bills.
This also does not establish a Codex SDK penalty. Both arms used the same Python SDK, Codex runtime 0.154.0, app-server path, and ChatGPT Pro authentication. The official Codex SDK documentation describes the Python SDK as controlling a local Codex app-server over JSON-RPC and using a pinned runtime. The SDK supplied control and telemetry; the coordinator's task selection, integration, recovery, and measurement policy determined how optimization work progressed. There is no SDK-only control arm here.
What isucon-harness controlled
The trial did use isucon-harness from provisioning through setup, build and deploy, benchmark execution, log collection, final reboot, and destruction. An audit matched 1,372 completed parent commands, 546 broker responses, and all 89 manifests. It found no ordinary parent bypass through direct SSH, direct AWS operations, direct benchmark execution, or benchmark-source reading. The two owner recoveries and post-deadline read-only diagnosis were recorded separately.
Each candidate was pinned to a commit. Deployment checked the built binary against the running ELF hash before scoring, while environment locks serialized reset, deployment, benchmark, and evidence collection. These controls establish which candidate was measured; they do not establish that the whole protocol completed. Because the coordinated arm required two owner recoveries and never reached its post-reboot benchmark, full protocol completion was false and fully autonomous completion was false.
Cost is bounded, not fully known
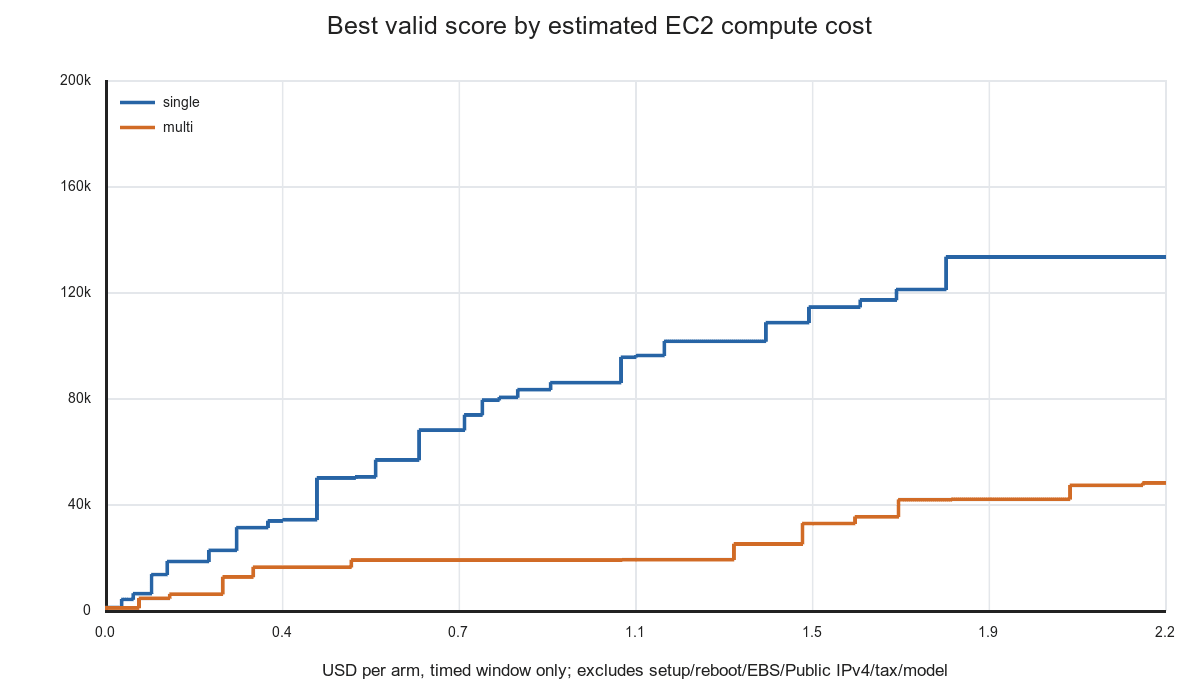 Best passing score against estimated EC2 compute cost
Saved AWS Pricing API rates were $0.107 per hour for c5.large and $0.428 per hour for c5.2xlarge. Each four-instance environment therefore cost an estimated $0.749 per hour, or $2.247 for the three-hour window. The two arms together used an estimated $4.494 of EC2 compute during the comparison. A conservative compute-only upper bound from provisioning through verified destruction was about $5.05 for both environments.
Those estimates exclude EBS, public IPv4, transfer, tax, discounts, and model or subscription cost. Actual all-in cost is unknown. All eight EC2 instances were verified terminated, with no remaining target EBS volumes, network interfaces, security groups, or key pairs.
What I would test next
The next changes should follow this order:
- Fix the controller's failure paths: return structured preparation errors, make revised-candidate references unique, and wait for service readiness before identity verification. A task must always reach a terminal state and the post-reboot benchmark must be reachable.
- Count database reads, writes, commits, and waits per completed ride. Choose the dominant path before broad cache changes.
- Test state aggregation and batching while holding the accepted durability and correctness rules fixed. Initialization and reboot recovery are part of the candidate, not cleanup details.
- Test moving nginx, TLS, and static delivery to app3 as a single topology change. Measure app1 capacity, database constraints, and score instead of assuming idle app3 capacity converts directly into throughput.
- Reduce parent integration overhead by standardizing worker returns and automating build, review evidence, and terminal-state checks. Judge it by passing candidates per hour, waiting time, and parent input tokens.
- Compare ETA matching with an objective derived from the published score rules, after the earlier write and state paths are understood.
Hardware and durability must be aligned before calling a future run a model comparison. An optional infrastructure ablation could hold one correct application fixed while changing c5 versus c7a, or value 1 versus value 2 under an explicitly accepted durability rule. That would estimate a confound; it would not justify relaxing correctness or durability to chase a score. Reconstructing the missing optimized application commit would likewise enable source comparison, while remaining separate from a blind model trial.
These are proposed experiments. I did not rerun ISUCON14 for this article, and I am not promising a score or multiplier from any one change.
The published-safe data are available as the summary JSON, score CSV, and evidence notes. For the earlier ISUCON11 single-versus-team studies and their different controls, see Astra Solo vs. Astra + GPT-5.6 Sol.